
Highlights
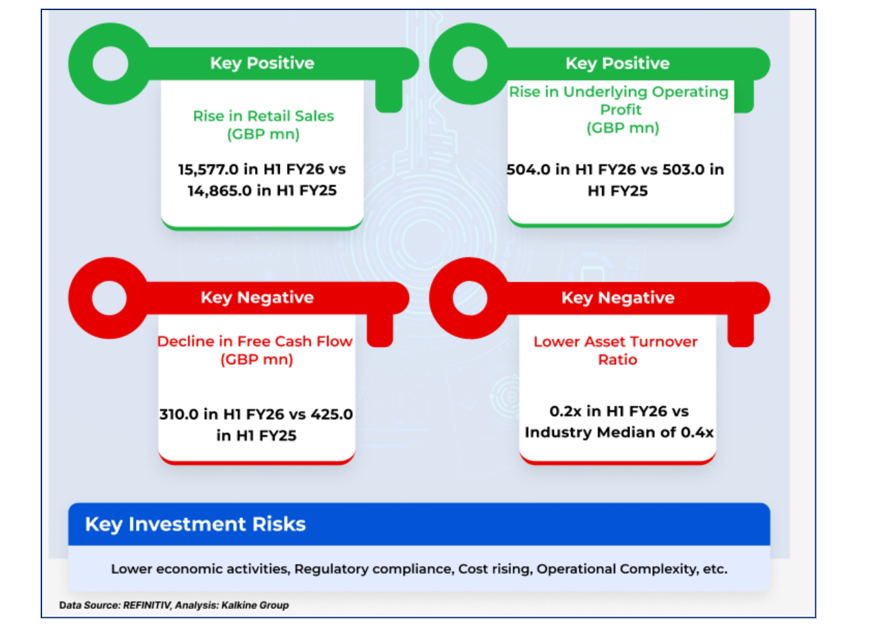
- Sainsbury’s H1 FY26 profit jumped 117.1% to GBP 165.0 million, driven by cost management and one-time gains.
- Group revenue rose 2.8% to GBP 17,581.0 million; operating profit up 0.6% to GBP 506.0 million in H1.
- GBP 1 billion cost-saving target and Nectar360 ahead of GBP 100 million profit goal.
J Sainsbury PLC (LSE:SBRY) is a UK-based retailer and a constituent of the FTSE 100 index. The company operates through three main segments: food retail, general merchandise and clothing, and financial services.
In the first half of financial year 2026 (H1 FY26), Sainsbury reported a Group revenue of GBP 17,581.0 million, a 2.8% increase from the first half of financial year 2025 (H1 FY25). Underlying operating profit saw a marginal rise of 0.6% to GBP 506.0 million. Crucially, Profit for the period surged by a significant 117.1% to GBP 165.0 million, a result attributed to profit more than doubling due to disciplined cost management and one-time gains, which successfully outweighed slower revenue growth.
Company Outlook
Sainsbury's expects that achieving market share gains for a fifth consecutive year will provide a solid foundation for continued volume-led growth and resilience. The company is targeting a clear GBP 1 billion cost-saving target which is intended to fund customer value initiatives without negatively impacting profit, thereby creating a self-reinforcing competitive cycle. Additionally, the company highlights that Nectar360 retail media is ahead of its GBP 100 million profit target, diversifying earnings into a capital-light, high-growth revenue stream.
Top Shareholders
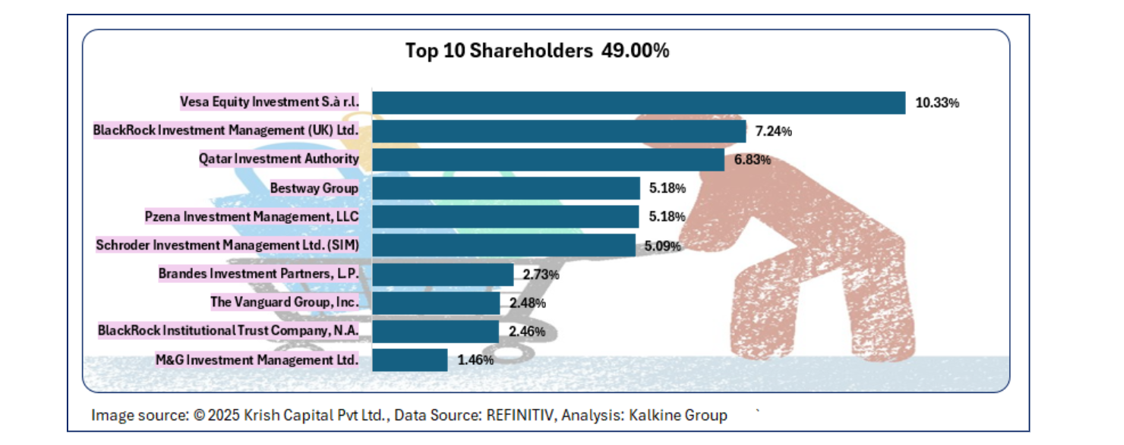
The top 10 shareholders collectively account for approximately 49.00% of the company’s total shareholding. Vesa Equity Investment S.à r.l. and BlackRock Investment Management (UK) Ltd. hold the largest stakes, at around 10.33% and 7.24%, respectively.
Stock Information
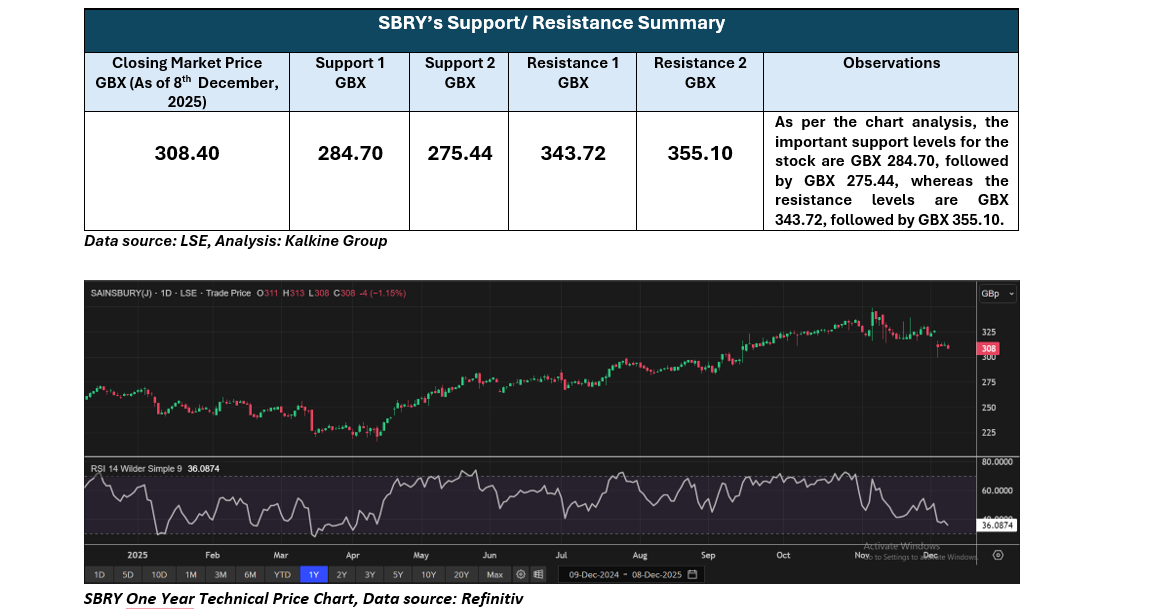
The stock has declined by approximately 4.69% over the past one week and risen by around 2.07% over the past three months. It has traded between a 52-week low of GBX 216.19 and a high of GBX 348.77, currently positioned above the average of the 52-week high-low.
Note 1: Past performance is not a reliable indicator of future performance.
Note 2: The reference date for all price data, currency, technical indicators, support, and resistance level is 08 December 2025. The reference data in this report has been partly sourced from EODHD/Others.
Note 3: Investment decisions should be made depending on an individual's appetite for upside potential, risks, holding duration, and any previous holdings. An 'Exit' from the stock can be considered if the Target Price mentioned as per the Valuation and or the technical levels provided has been achieved and is subject to the factors discussed above.
Note 4: Target Price refers to a price level which the stock is expected to reach as per the relative valuation method and or technical analysis taking into consideration both short-term and long-term scenarios.
Note 5: ‘Kalkine reports are prepared based on the stock prices captured either from the London Stock Exchange (LSE) and or EODHD/Others. Typically, both sources (LSE and or EODHD/Others) may reflect stock prices with a delay which could be a lag of 15-20 minutes. There can be no assurance that future results or events will be consistent with the information provided in the report. The information is subject to change without any prior notice.
Note 6: Dividend Yield may vary as per the stock price movement.
Technical Indicators Defined: -
Support: A level at which the stock prices tend to find support if they are falling, and a downtrend may take a pause backed by demand or buying interest. Support 1 refers to the nearby support level for the stock and if the price breaches the level, then Support 2 may act as the crucial support level for the stock.
Resistance: A level at which the stock prices tend to find resistance when they are rising, and an uptrend may take a pause due to profit booking or selling interest. Resistance 1 refers to the nearby resistance level for the stock and if the price surpasses the level, then Resistance 2 may act as the crucial resistance level for the stock.


 Please wait processing your request...