
Image source: Shutterstock
Highlights
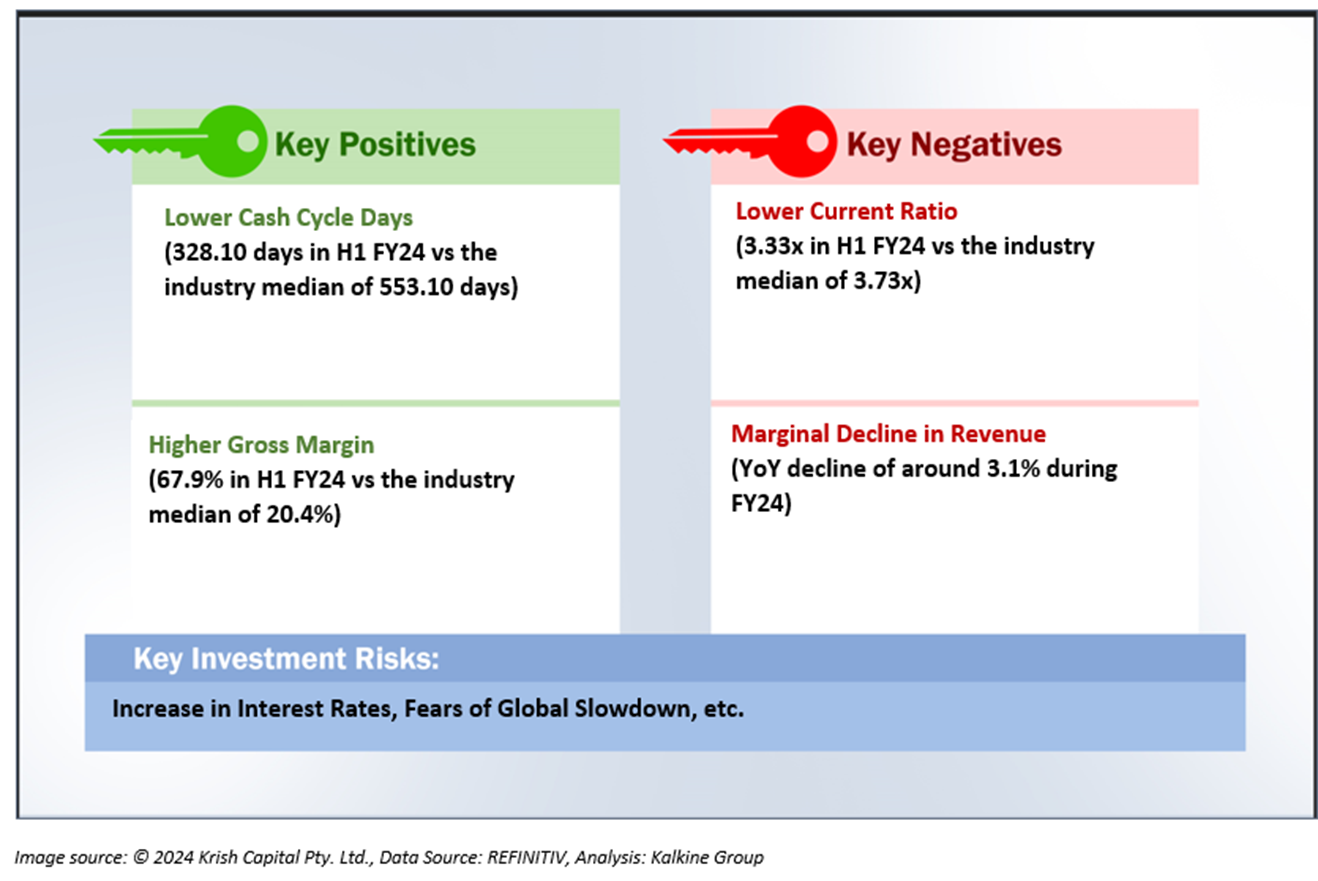
- Sanderson Design Group witnessed ~11.9% YoY surge in statutory profit after tax in H1 FY24.
- Its top-line business dropped by 2.1% YoY from GBP 90 million in H1 FY23 to GBP 56.70 million in H1 FY24, due to challenging market in the UK.
- SDG has secured over £10 million of Group sales from high-margin licensing in FY24.
FTSE AIM All-Share index listed luxury interior design firm Sanderson Design Group PLC (LSE: SDG) holds specialisation in design and manufacturing of wallpaper and fabrics.
For the first half of the fiscal year 2024, the Group witnessed approximately 11.9% year-on-year surge in statutory profit after tax. It rose to GBP 4.70 million in H1 FY24 from GBP 4.20 million in H1 FY23. However, its top-line business dropped by 2.1% YoY from GBP 57.90 million in H1 FY23 to GBP 56.70 million in H1 FY24, due to challenging market in the UK.
As of 31 January 2024, SDG had a net cash position of £16.2 million, as compared to £15.4 million at the end of FY23.
SDG has secured over £10 million of Group sales from high-margin licensing in FY24.
With an ex-dividend date of 19 October 2023, Sanderson Design Group paid an interim dividend of 0.75 pence per share in November 2023.
The group is registering key licence renewals with companies, like Bedeck, NEXT and Williams Sonoma. Also, it has ticked off new partnerships with core bedding and Japanese firms. Going forth, it will have greater focus on the Licensing division boosting its brands and manufacturing processes and amplifying profitability in domestic and international market.

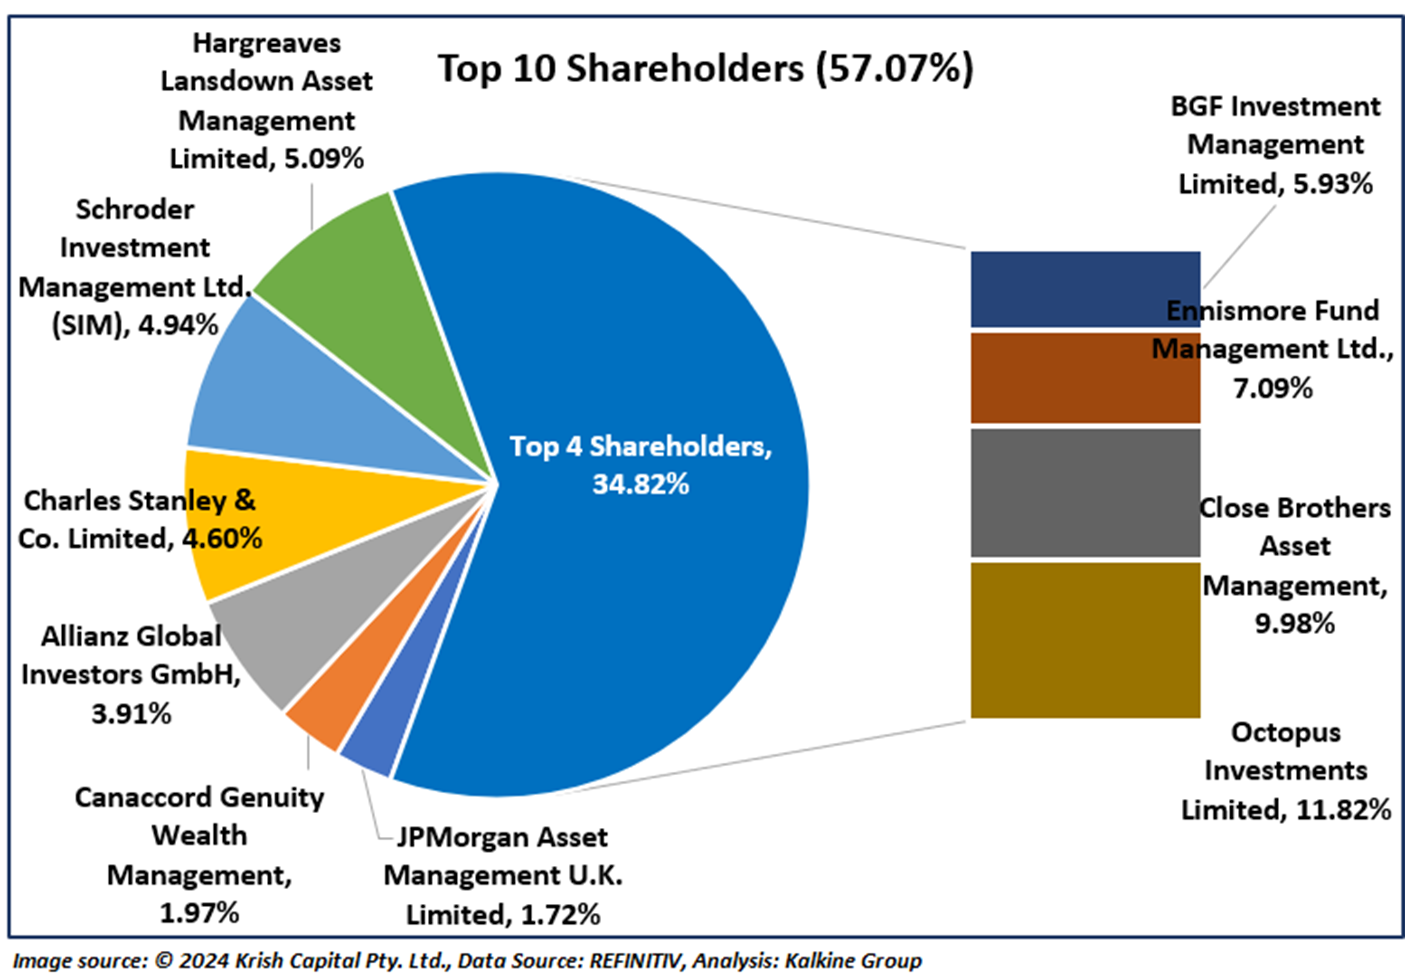
Top 10 Shareholders:
While Octopus Investments Limited is the biggest shareholder in SDG with over 11.82% shareholding, Close Brothers Asset Management is the second-biggest shareholder with approximately 9.98% shareholding. Notably, over 57.07% of the total shareholdings is held by its top 10 shareholders.
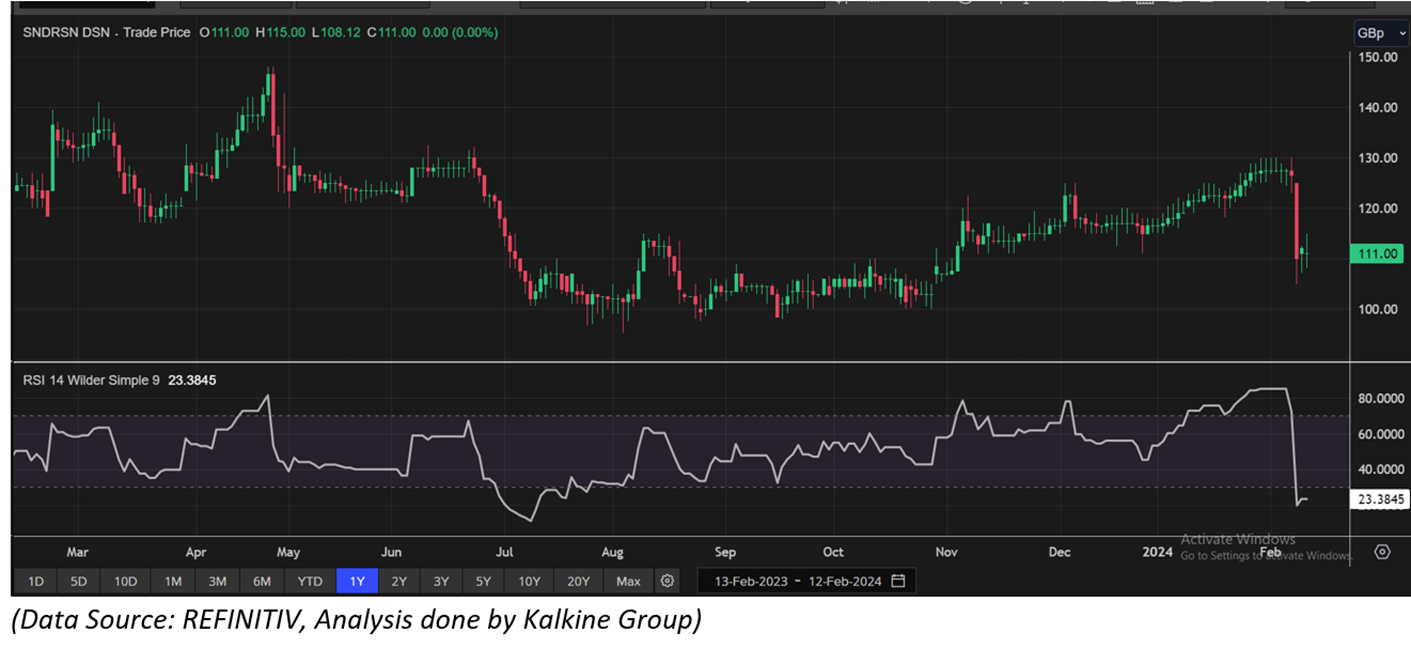
Stock Price Performance
SDG’s stock price has dropped by 6.98% in the last one month. However, it has jumped 1.29% over the last six months. Its 52-week low and high price stand at GBX 95.31 and GBX 148.00, respectively.
Note 1: Past performance is not a reliable indicator of future performance.
Note 2: The reference data for all price data, currency, technical indicators, support, and resistance levels is 12 February 2024. The reference data in this report has been partly sourced from EODHD/Others.


 Please wait processing your request...