_11_26_2025_10_36_42_905939.png)
Highlights
- Serabi Gold delivered YoY growth in Q2 FY25, with revenue rising 55.8% and PAT increasing 83.6%.
- Improved production volumes, favourable gold prices, and higher processed grades boosted profitability.
- The company remains on track to achieve its 44,000–47,000 ounces FY25 production target, supported by consistent operational performance.
Serabi Gold PLC (LSE:SRB) is a United Kingdom-based gold mining and development company listed on the FTSE AIM All-Share index. The company concentrates its activities on gold production and exploration in Brazil, operating the Palito Mining Complex and advancing the Coringa Project in the Tapajós region of Pará.
Serabi Gold reported a record quarterly production of 12,090 ounces in Q3 2025, attributed to higher grades and improved operational efficiency. This achievement resulted in a cash balance of USD 38.8 million, supporting the company’s annual guidance and enabling continued progress in its growth-focused exploration initiatives.
Serabi Gold’s Q2 FY25 financial performance shows significant year-over-year improvement across all major metrics. Revenue increased to USD 34.90 million from USD 22.40 million (a 55.8% rise), driven by higher production volumes and better average gold prices. Gross operating profit climbed 71.6%, reaching USD 17.50 million, supported by processed gold grades. Profit after tax (PAT) rose 83.6% to USD 10.10 million, reflecting the combined impact of higher revenue and favourable realized gold prices.
Company Outlook
Serabi Gold expects a steady second half of the financial year 2025 (FY25) as it works toward its full-year production target of 44,000 to 47,000 ounces for 2025. The company’s consistent operational performance and year-to-date production support management’s confidence in meeting this guidance, positioning the operation to achieve its annual objectives.
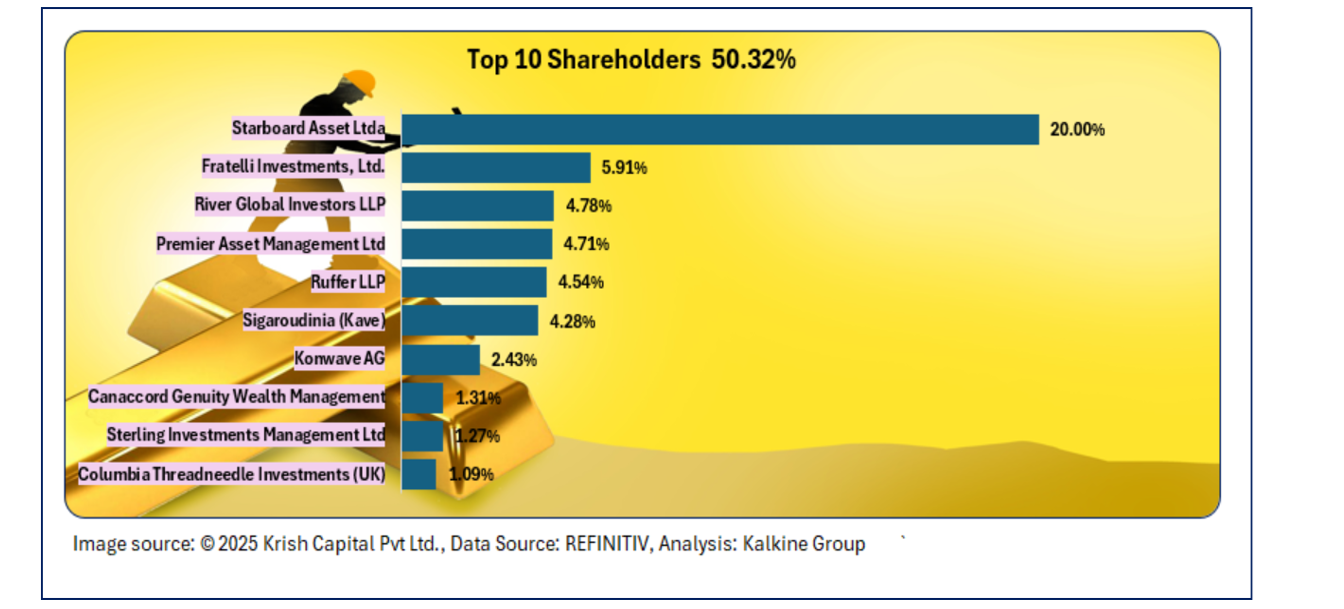
Top 10 Shareholders
The top 10 shareholders collectively account for approximately 50.32% of the company’s total shareholding. Starboard Asset Ltda and Fratelli Investments, Ltd. are the largest investors, holding around 20.00% and 5.91% stakes, respectively.
Stock Performance
Over the past week, SRB’s share price slipped by approximately 4.7%. Over the past three months, however, it has climbed notably, up around 26.6%. The stock is currently trading above the midpoint of its 52-week range (high of 300 GBX, low of 81.53 GBX).
Note 1: Past performance is not a reliable indicator of future performance.
Note 2: The reference date for all price data, currency, technical indicators, support, and resistance level is 24 November 2025. The reference data in this report has been partly sourced from EODHD/Others.
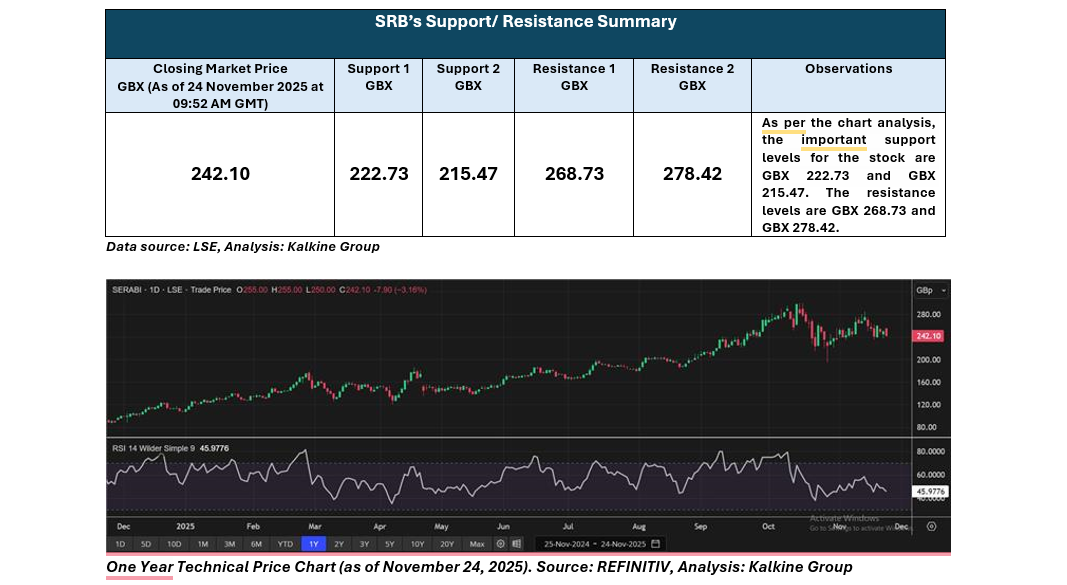
Technical Indicators Defined: -
Support: A level at which the stock prices tend to find support if they are falling, and a downtrend may take a pause backed by demand or buying interest. Support 1 refers to the nearby support level for the stock and if the price breaches the level, then Support 2 may act as the crucial support level for the stock.
Resistance: A level at which the stock prices tend to find resistance when they are rising, and an uptrend may take a pause due to profit booking or selling interest. Resistance 1 refers to the nearby resistance level for the stock and if the price surpasses the level, then Resistance 2 may act as the crucial resistance level for the stock.


 Please wait processing your request...