_09_25_2025_10_19_32_370156.png)
Image source: © 2025 Krish Capital Pty.Ltd
Highlights
- SHEL’s H1FY25 revenue declined 8.4% YoY to USD 134.64 billion on weaker energy prices
- Net income attributable to shareholders dropped 22.9% YoY to USD 8.38 billion
- FY25 capex forecast remains USD 20–22 billion, with Q3 output seen improving
Shell PLC (LSE:SHEL) is an FTSE 100 energy and petrochemical company. It explores, produces, refines, and markets oil and natural gas. The company also manufactures and sells chemicals.
In the first half of financial year 2025 (H1FY25), Shell reported revenue of USD 134.64 billion, down 8.4% from USD 146.94 billion in H1 FY24. The decline was mainly due to lower realised liquids and LNG prices, along with weaker refining and chemical margins. Adjusted EBITDA fell 19.6% YoY to USD 28.56 billion in H1FY25, compared to USD 35.52 billion a year earlier. Income attributable to shareholders for the period dropped 22.9% YoY to USD 8.38 billion, reflecting lower commodity prices, reduced trading and refining margins, and impairment charges.
Recent Business Update
On 09 September 2025, SHEL’s management declared an interim dividend of USD 0.08 per share for Q2 FY25. It was paid to shareholders on 19 September 2025.
Company Outlook
For FY25, Shell expects cash capital expenditures (capex) in the range of USD 20–22 billion, broadly in line with the FY24 level of USD 21 billion. The guidance highlights disciplined reinvestment while maintaining a balance between shareholder returns and debt reduction.
For Q3, production is projected at 910–970k boe/d, while LNG liquefaction volumes are forecast at 6.7–7.3 mt, supported by the ramp-up at LNG Canada and recovery in Australian LNG operations following maintenance.
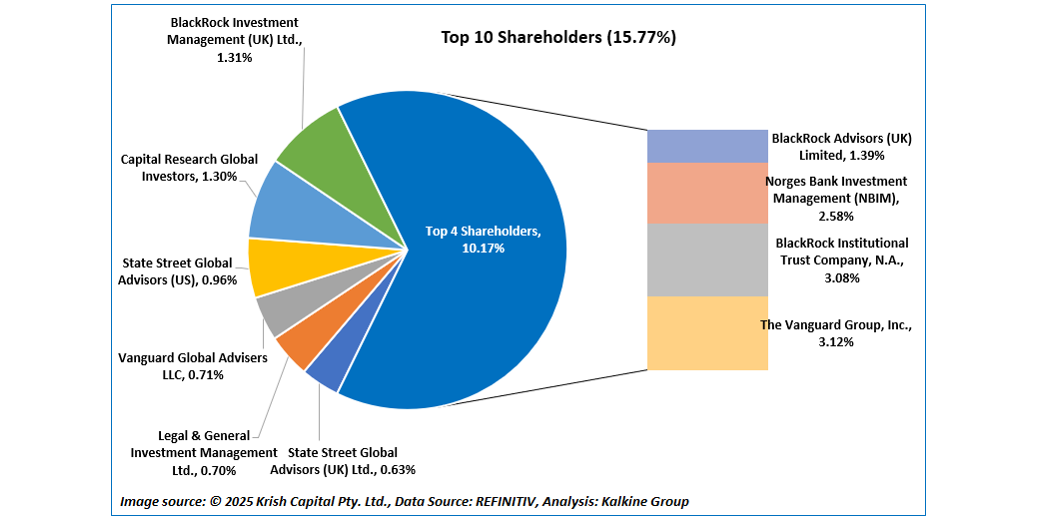
Top 10 Shareholders
The top 10 shareholders of SHEL collectively hold about 15.77% of total shares. The largest stakes are with The Vanguard Group, Inc. (~3.12%) and BlackRock Institutional Trust Company, N.A. (~3.08%).
Stock Information
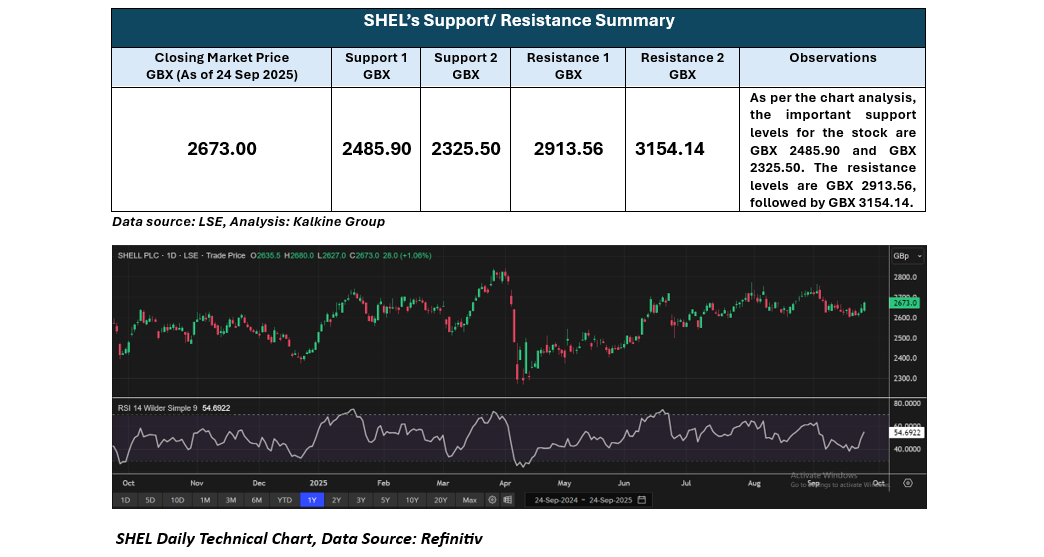
The stock price of SHEL has declined by around 0.70% in the past month and appreciated by ~4.27% in the past three months. The stock’s 52-week low and high span from GBX 2269.92 to GBX 2843. As of 24 September 2025, the stock’s closing price is GBX 2673.00.
Note 1: Past performance is not a reliable indicator of future performance.
Note 2: The reference data for all price data, currency, technical indicators, support, and resistance levels is 24 September 2025. The reference data in this report has been partly sourced from EODHD/Others.
Technical Indicators Defined
Support: A level at which the stock prices tend to find support if they are falling, and a downtrend may take a pause backed by demand or buying interest. Support 1 refers to the nearby support level for the stock and if the price breaches the level, then Support 2 may act as the crucial support level for the stock.
Resistance: A level at which the stock prices tend to find resistance when they are rising, and an uptrend may take a pause due to profit booking or selling interest. Resistance 1 refers to the nearby resistance level for the stock and if the price surpasses the level, then Resistance 2 may act as the crucial resistance level for the stock.


 Please wait processing your request...