
Highlights
- Smith & Nephew’s H1FY25 revenue reached USD 2,961 million, rising 4.7% YoY.
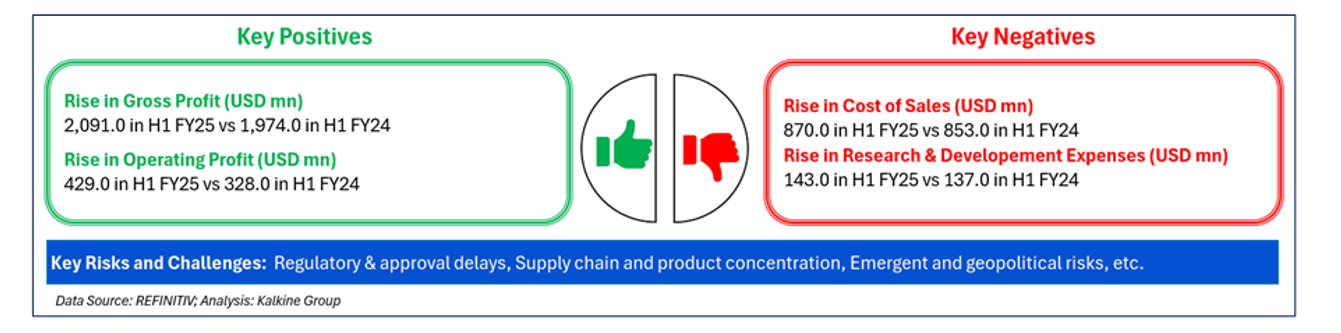
- Gross profit for H1 increased to USD 2,091 million, supported by higher revenue and product mix.
- Product innovation and new commercial launches contributed to revenue growth.
- The company expects FY25 underlying revenue growth of around 5%.
- FY25 trading profit margin guidance remains in the 19.0%–20.0% range despite tariff headwinds.
Smith & Nephew PLC (LSE:SN.) is an FTSE 100 medical technology group focused on developing, manufacturing, and commercializing devices used for the repair, regeneration, and replacement of both soft and hard tissue.
1H Financial Update
The company reported revenue of USD 2,961.00 million in the first half of fiscal year 2025 (H1FY25) compared with USD 2,827.00 million in H1FY24, reflecting a YoY change of 4.7%. Revenue growth was driven by successful product innovation and new commercial launches. Gross profit was USD 2,091.00 million versus USD 1,974.00 million in H1FY24, a YoY change of 5.9%, supported by higher revenue and a favorable shift in the product mix. Profit for the period was USD 293.00 million compared with USD 214.00 million in H1 FY24, a YoY change of 36.9%, due to lower restructuring expenses and reduced net finance costs.
Company Outlook
The company reaffirmed its 2025 full‑year outlook, expecting around 5% underlying revenue growth and a trading profit margin in the range of 19.0–20.0%. The guidance includes an impact of USD 15–20 million in net tariff headwinds. It expects improved second‑half performance from easing pressures in China and ongoing operational savings, with further margin expansion after 2025.
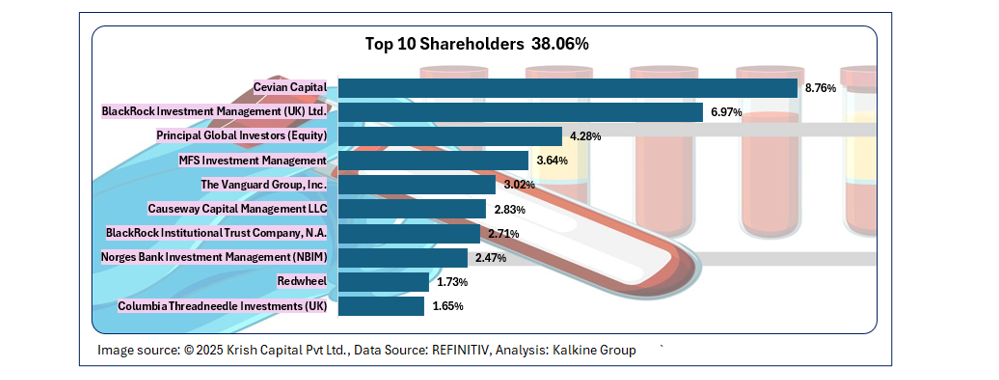
Top 10 Shareholders
The top ten shareholders collectively hold about 38.06% of the company. Cevian Capital and BlackRock Investment Management (UK) Ltd. are the largest holders, with stakes of approximately 8.76% and 6.97%, respectively.
Stock Information
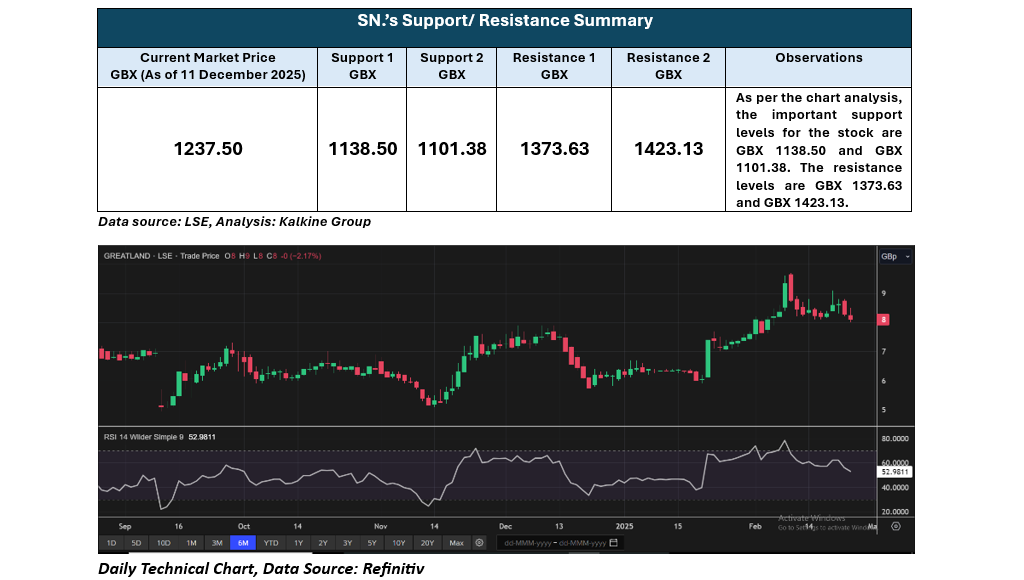
Over the last week, the stock performance has shown a decline of 1.25%. Over the last three months, the stock performance has shown an increase of 11.60%. The stock is trading above the average of the 52-week high price of GBX 1,441.50 and the 52-week low price of GBX 937.80.
Note 1: Past performance is not a reliable indicator of future performance.
Note 2: The reference data for all price data, currency, technical indicators, support, and resistance levels is 11 December 2025. The reference data in this report has been partly sourced from EODHD/Others.
Technical Indicators Defined
Support: A level at which the stock prices tend to find support if they are falling, and a downtrend may take a pause backed by demand or buying interest. Support 1 refers to the nearby support level for the stock and if the price breaches the level, then Support 2 may act as the crucial support level for the stock.
Resistance: A level at which the stock prices tend to find resistance when they are rising, and an uptrend may take a pause due to profit booking or selling interest. Resistance 1 refers to the nearby resistance level for the stock and if the price surpasses the level, then Resistance 2 may act as the crucial resistance level for the stock.


 Please wait processing your request...