
Image source: Shutterstock
Highlights
- In FY24, Standard Chartered's operating income rose 13.3% YoY to GBP 19,696 million, driven by higher net interest and non-interest income
- Loans and advances to customers fell 2.1% in FY24, but underlying loan growth increased by USD 12 billion, or 4%
- The bank has proposed a final dividend of 28 cents per share for FY24, raising the full-year total by 37% YoY
- Standard Chartered completed USD 2.5 billion in buybacks in 2024 and announced a new USD 1.5 billion buyback program
- The company is targeting 5-7% CAGR for operating income from 2023 to 2026, with growth expected to lean toward the upper end
Standard Chartered PLC (LSE:STAN) is a British multinational bank. It has operations in corporate and investment banking, wealth management, and treasury services.
In the financial year 2024 (FY24), STAN’s operating income surged 13.3% YoY to GBP 19,696 million. This growth was driven by a 10% rise in net interest income and a 20% rise in non-interest income, supported by healthy performances across wealth solutions, global markets, and global banking.
Loans and advances to customers fell by 2.1% in FY24, mainly due to foreign exchange movements and reductions in Treasury and Global markets securities-backed lending. However, on an underlying basis, adjusted for these factors, loans grew by USD 12 billion or 4%, reflecting core business growth.
Standard Chartered has proposed a final dividend of 28 cents per share for FY24. This brings the full-year total to 37 cents, up 37% YoY. The group completed USD 2.5 billion in buybacks during 2024 and announced a new USD 1.5 billion buyback, bringing total shareholder distributions since the 2023 results to USD 4.9 billion.
Company Outlook
Standard Chartered has provided guidance for 2025 and 2026, expecting operating income to grow by 5-7% CAGR from 2023 to 2026 at constant currency. The bank is on track to reach the upper end of this range, though growth in 2025 may fall slightly below it. The bank aims to deliver positive income-to-cost jaws annually, with modest growth in loans and RWAs. It also expects the loan-loss rate to return to the historical range of 30-35 bps. Standard Chartered plans to maintain a CET1 ratio within its target of 13-14%.
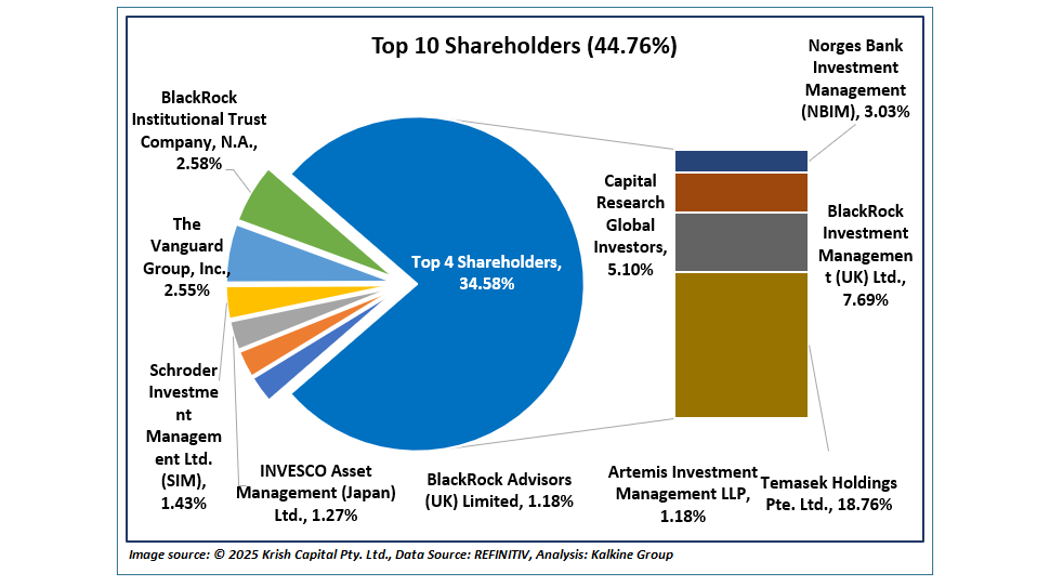
Top 10 Shareholders
The top 10 shareholders of Standard Chartered collectively own approximately 44.76% of the total shares. Temasek Holdings Pte. Ltd. holds the largest stake, with around 18.76%, followed by BlackRock Investment Management (UK) Ltd. with about 7.69%, as shown in the chart below:
Stock Information
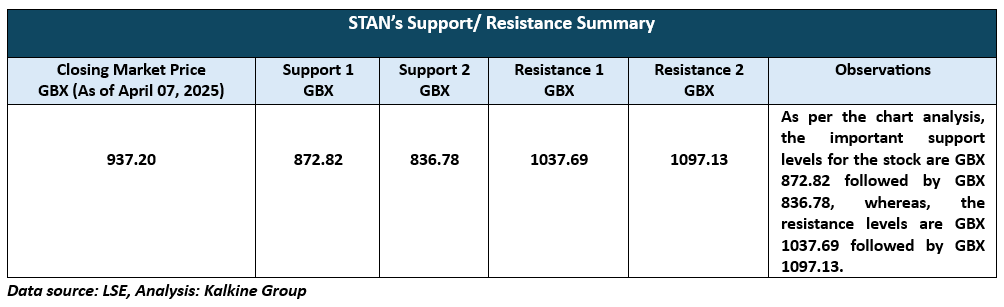
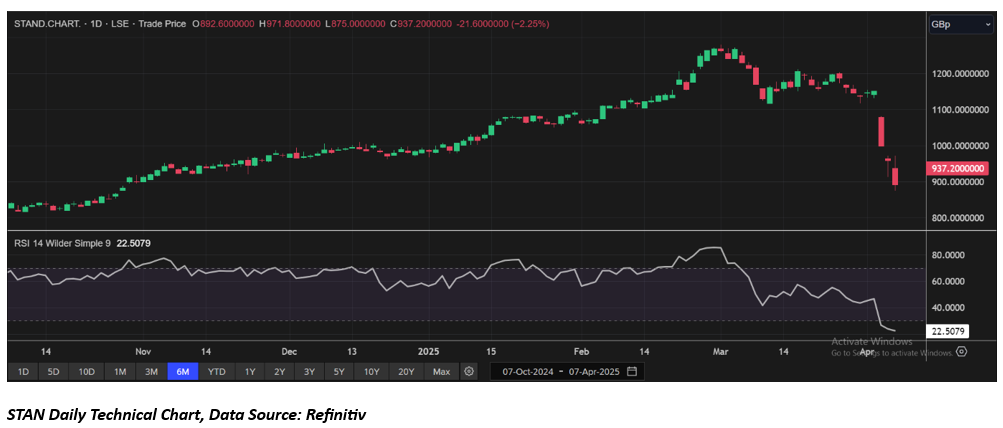
The stock price of STAN has depreciated by around 23.80% in the past month. However, it has appreciated by around 10.13% in the past six months. The stock’s 52-week low and high spans from GBX 631.20 to GBX 1281.00. As of 07 April 2025, the stock’s closing price is GBX 937.20.
Note 1: Past performance is not a reliable indicator of future performance.
Note 2: The reference data for all price data, currency, technical indicators, support, and resistance levels is April 07, 2025. The reference data in this report has been partly sourced from EODHD/Others.
Technical Indicators Defined
Support: A level at which the stock prices tend to find support if they are falling, and a downtrend may take a pause backed by demand or buying interest. Support 1 refers to the nearby support level for the stock and if the price breaches the level, then Support 2 may act as the crucial support level for the stock.
Resistance: A level at which the stock prices tend to find resistance when they are rising, and an uptrend may take a pause due to profit booking or selling interest. Resistance 1 refers to the nearby resistance level for the stock and if the price surpasses the level, then Resistance 2 may act as the crucial resistance level for the stock.


 Please wait processing your request...