_10_27_2025_03_30_24_989296.jpg)
Highlights
- Tekcapital’s administrative and other expenses dropped 71.0% YoY to USD 6.10 million in H1FY25
- In H1FY25, operating profit declined 72.2% YoY to USD 5.40 million amid lower valuation gains
- Planned NASDAQ IPO of Guident seen as a key near-term value catalyst
- TEK shares gained 24.02% over three months
Tekcapital PLC (LSE:TEK), a member of the FTSE AIM All-Share Index, is a UK-based intellectual property investment group. The company focuses on commercialising university-developed innovations to create impactful products that enhance the quality of life.
For the first half of the financial year 2025 (H1FY25), TEK’s administrative and other expenses declined 71.0% YoY to USD 6.10 million, reflecting a shift in the company’s operating model and improved cost control. Operating profit and profit before tax fell 72.2% YoY to USD 5.40 million, mainly due to lower unrealised valuation gains from portfolio investments. As a result, total comprehensive income decreased 73.3% YoY to USD 5.20 million, impacted by reduced portfolio revaluations and negative foreign currency translation effects.
Company Outlook
Tekcapital’s outlook for the second half of FY25 hinges on its continued focus on nurturing and monetizing its intellectual property portfolio.
A key near-term catalyst is the planned NASDAQ IPO of Guident, which is expected to unlock value. Meanwhile, progress by other portfolio companies—such as MicroSalt and Lucyd—toward their commercial and revenue milestones will play an essential role in driving future portfolio valuations and potential shareholder returns.
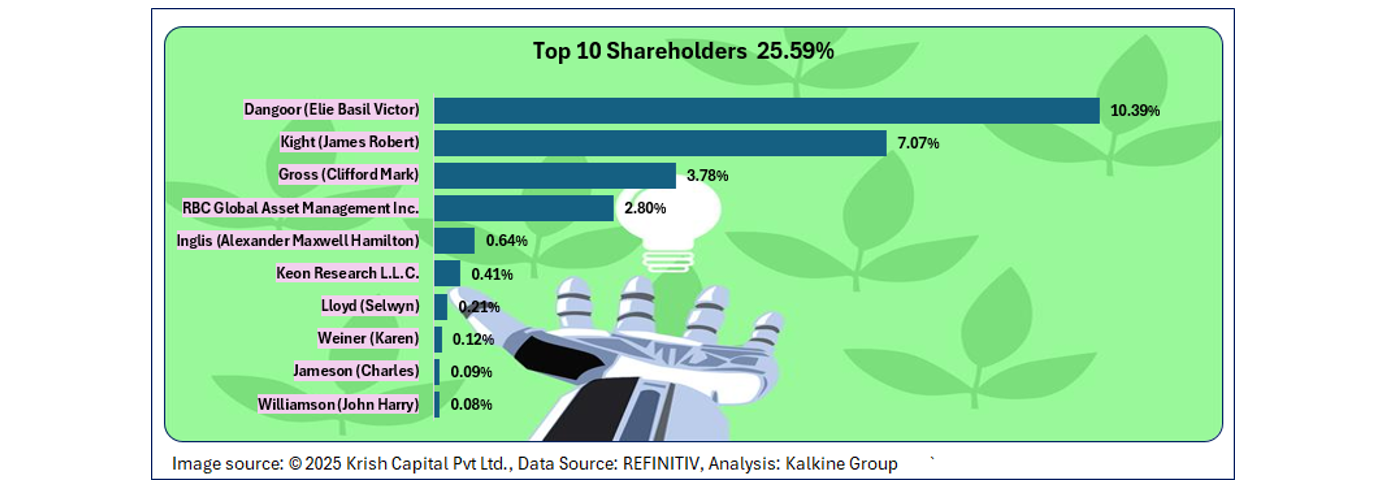
Top 10 Shareholders
The top ten shareholders collectively hold approximately 25.59% of Tekcapital’s total shares. Major shareholders include Elie Basil Victor Dangoor with around 10.39% and James Robert Kight with approximately 7.07%.
Stock Information
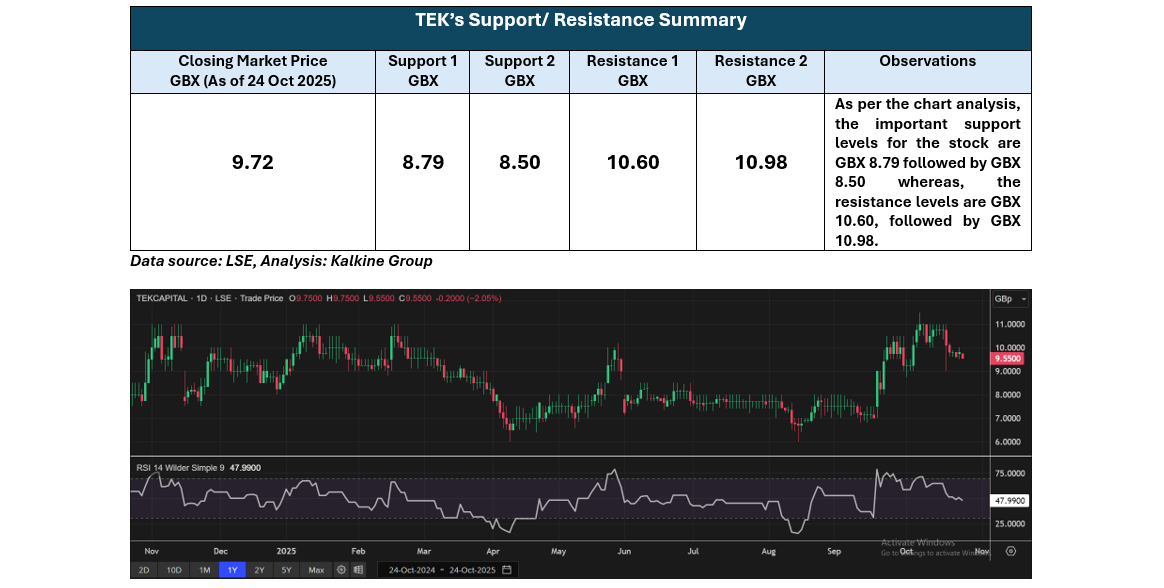
TEK stock has shown a positive trend over the recent quarter, gaining 29.67% over six months, although the past week reflected a decline of 5.44% in price. The stock is currently trading above the average of its 52-week high and low, which stand at GBX 11.50 and GBX 6.00, respectively.
Note 1: Past performance is not a reliable indicator of future performance.
Note 2: The reference data for all price data, currency, technical indicators, support, and resistance levels is 24 October 2025. The reference data in this report has been partly sourced from EODHD/Others.
Technical Indicators Defined
Support: A level at which the stock prices tend to find support if they are falling, and a downtrend may take a pause backed by demand or buying interest. Support 1 refers to the nearby support level for the stock and if the price breaches the level, then Support 2 may act as the crucial support level for the stock.
Resistance: A level at which the stock prices tend to find resistance when they are rising, and an uptrend may take a pause due to profit booking or selling interest. Resistance 1 refers to the nearby resistance level for the stock and if the price surpasses the level, then Resistance 2 may act as the crucial resistance level for the stock.


 Please wait processing your request...