
Highlights
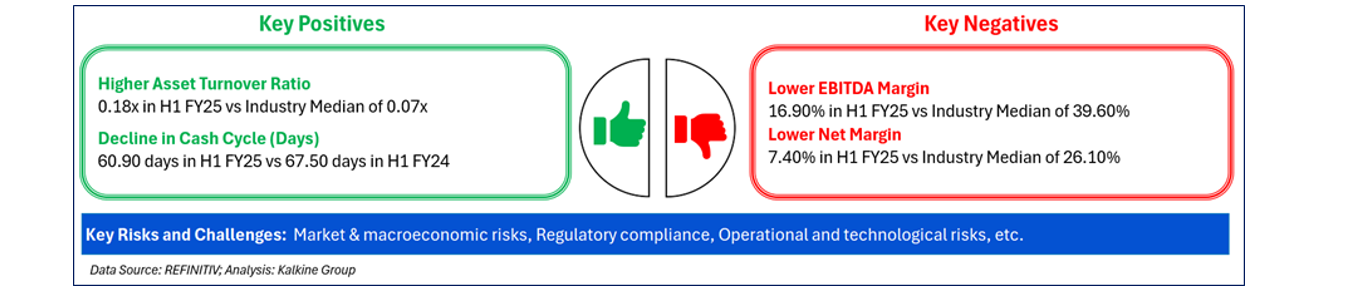
- ICAP’s H1FY25 revenue rose 7.0% year-on-year to GBP 1,224.00 million, supported by Global Broking activity
- EBITDA increased 6.8% annually to GBP 220.00 million, reflecting revenue growth and cost discipline
- Attributable earnings grew 5.7% year-on-year to GBP 130.00 million, aided by finance cost management
- For FY25, management maintained its earnings outlook amid macroeconomic and geopolitical uncertainties
TP ICAP Group PLC (LSE:TCAP), a constituent of the FTSE 250, operates platforms and delivers data solutions for global financial markets. The company facilitates transactions by connecting buyers and sellers across asset classes such as equities, fixed income, energy, and commodities through its business segments, including Global Broking, Energy & Commodities, Liquidnet, and Parameta Solutions.
The company reported revenue of GBP 1,224.00 million in the first half of fiscal year 2025 (H1FY25), up 7.0% year-on-year from GBP 1,144.00 million in H1FY24. The increase in revenue was supported by a decent performance in the Global Broking division.
EBITDA rose to GBP 220.00 million from GBP 206.00 million in the prior-year period, reflecting a 6.8% annual increase, driven by steady revenue performance and disciplined cost control.
Attributable earnings also increased to GBP 130.00 million, compared with GBP 123.00 million a year earlier, marking a 5.7% rise, supported by effective management of finance costs.
Company Outlook for FY25
Looking ahead, management highlighted that macroeconomic and geopolitical developments could increase market volatility, potentially supporting trading activity, while fluctuations in USD exchange rates may influence financial outcomes. Despite these external factors, the Group has maintained its annual earnings forecast and continues to progress with its strategic transformation initiatives, diversification efforts, and capital management priorities for FY25.
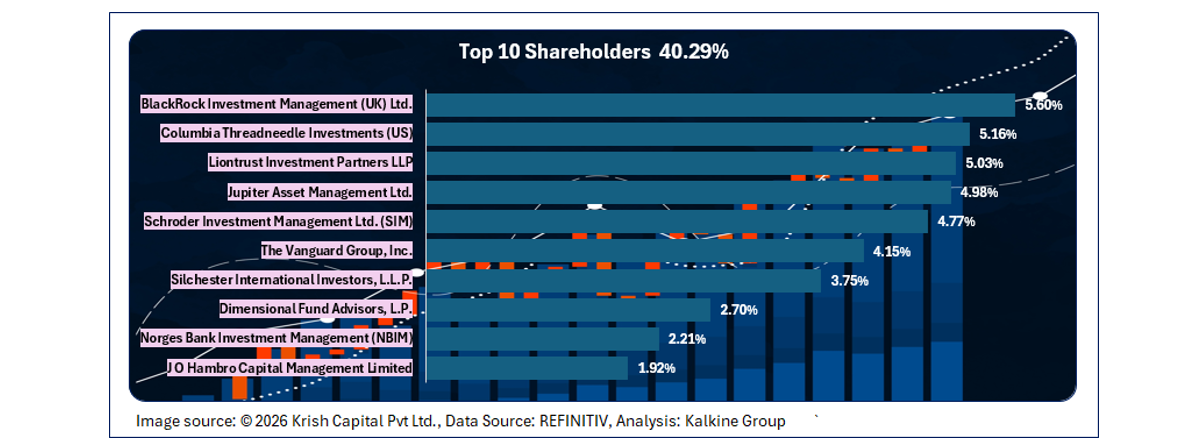
Top 10 Shareholders
The top ten shareholders collectively account for around 40.29% of the company’s total shareholding. Among them, BlackRock Investment Management (UK) Ltd. and Columbia Threadneedle Investments (US) are the largest holders, with stakes of approximately 5.60% and 5.16%, respectively.
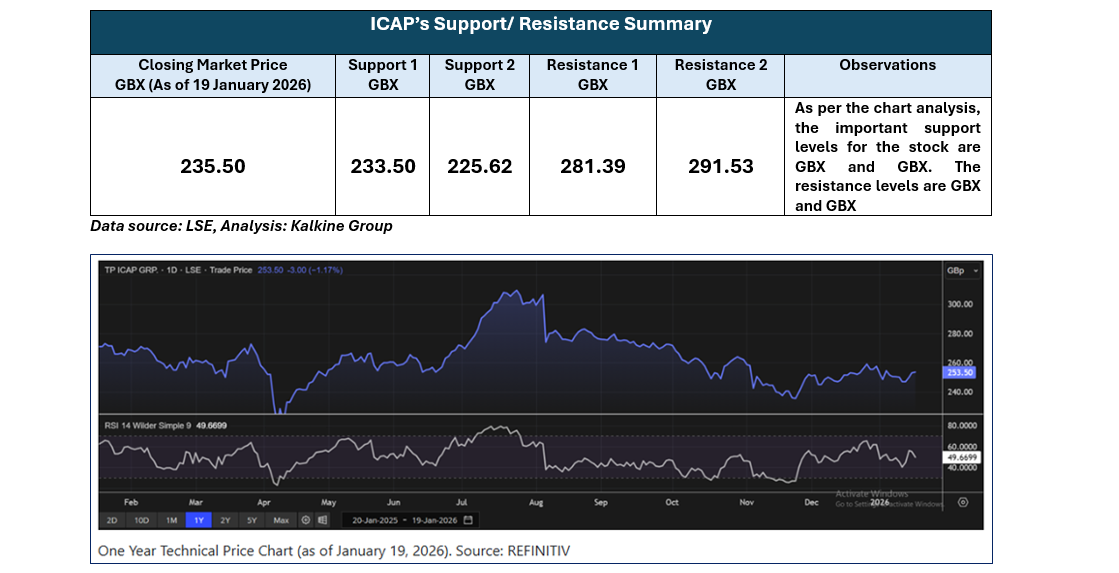
Stock Performance SnapshotThe stock recorded a marginal gain of 0.19% over the past week, while it declined 1.36% over the last three months. The shares are currently trading below the average of the 52-week high price of GBX 315.00 and the 52-week low price of GBX 217.00.
Note 1: Past performance is not a reliable indicator of future performance.
Note 2: The reference data for all price data, currency, technical indicators, support, and resistance levels is 19 January 2026. The reference data in this report has been partly sourced from EODHD/Others.
Technical Indicators Defined
Support: A level at which the stock prices tend to find support if they are falling, and a downtrend may take a pause backed by demand or buying interest. Support 1 refers to the nearby support level for the stock and if the price breaches the level, then Support 2 may act as the crucial support level for the stock.
Resistance: A level at which the stock prices tend to find resistance when they are rising, and an uptrend may take a pause due to profit booking or selling interest. Resistance 1 refers to the nearby resistance level for the stock and if the price surpasses the level, then Resistance 2 may act as the crucial resistance level for the stock.


 Please wait processing your request...