_09_22_2025_02_08_19_642879.jpg)
Image source: © 2025 Krish Capital Pty.Ltd
Highlights
- TCAP’s H1 revenue grew 7.0% YoY to GBP 1,224.00 million, driven by Global Broking.
- Asset turnover improved to 0.18x, well above the industry median of 0.07x.
- Profitability remained pressured, with EBITDA margin at 16.90% versus a 41.90% of the industry median.
TP ICAP Group PLC (LSE:TCAP) builds platforms and provides data for financial markets. Its main job is to bring buyers and sellers together in areas like stocks, bonds, oil, and gas. The company is listed in the FTSE 250 index.
For the first half of FY25 (H1FY25), the company reported total revenue of GBP 1,224.00 million, up 7.0% from GBP 1,144.00 million in H1FY24, supported by higher performance in the Global Broking division. EBITDA increased by 6.8% YoY to GBP 220.00 million compared to GBP 206.00 million in the prior corresponding period (pcp), reflecting revenue growth alongside disciplined cost management. Attributable earnings rose 5.7% YoY to GBP 130.00 million in H1FY25 from GBP 123.00 million in the pcp, aided by effective management of finance costs.
During the reported period, the company recorded key positives with improvements in operational efficiency. The asset turnover ratio rose to 0.18x, significantly above the industry median of 0.07x. Additionally, the cash cycle declined to 60.90 days compared to 67.50 days in H1FY24.
On the other hand, profitability remained under pressure relative to peers. The EBITDA margin stood at 16.90%, well below the industry median of 41.90%. Similarly, the net margin was 7.40%, compared to the industry median of 26.80%.
Company Outlook
The company’s outlook is influenced by macroeconomic and geopolitical conditions that contribute to market volatility, typically supporting trading activity. Movements in foreign exchange rates, especially the US dollar relative to sterling, may affect results given the share of USD-denominated revenue. The Group remains focused on its strategic priorities of transformation, diversification, and capital management, while upholding its current earnings expectations for the year.
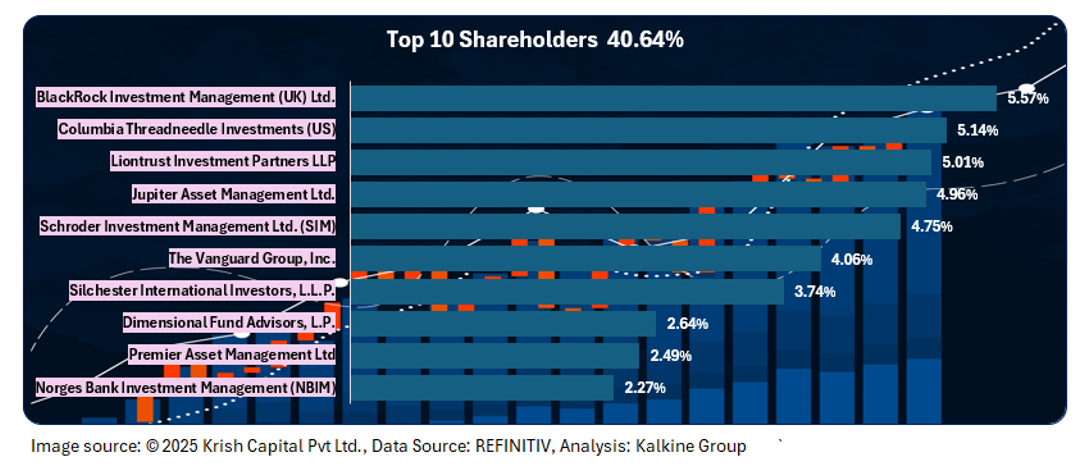
Top 10 Shareholders
The top 10 shareholders of TCAP together account for ~40.64% of the total shareholding in the company. BlackRock Investment Management (UK) Ltd. and Columbia Threadneedle Investments (US) hold the maximum stake at ~5.57% and ~5.14%, respectively.
Stock Information
As of the closing price on 17 September 2025, the stock has gained approximately 5.64% over the past three months and about 1.87% over the past six months. It has a 52-week high of GBX 315.00 and a 52-week low of GBX 217.00, with the current price trading below the midpoint of this range.
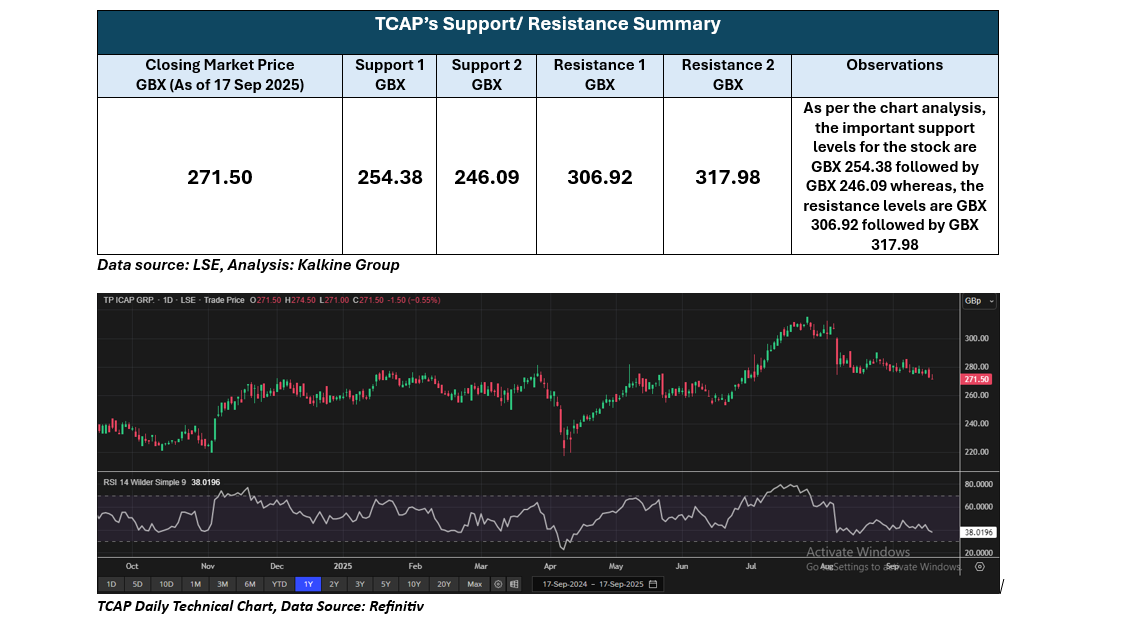
Note 1: Past performance is not a reliable indicator of future performance.
Note 2: The reference data for all price data, currency, technical indicators, support, and resistance levels is 17 September 2025. The reference data in this report has been partly sourced from EODHD/Others.
Technical Indicators Defined
Support: A level at which the stock prices tend to find support if they are falling, and a downtrend may take a pause backed by demand or buying interest. Support 1 refers to the nearby support level for the stock and if the price breaches the level, then Support 2 may act as the crucial support level for the stock.
Resistance: A level at which the stock prices tend to find resistance when they are rising, and an uptrend may take a pause due to profit booking or selling interest. Resistance 1 refers to the nearby resistance level for the stock and if the price surpasses the level, then Resistance 2 may act as the crucial resistance level for the stock.


 Please wait processing your request...