
Image source: Shutterstock
Highlights
- Sanderson Design’s statutory profit after tax registered a 11.9% year-on-year (YoY) rise in H1 FY24.
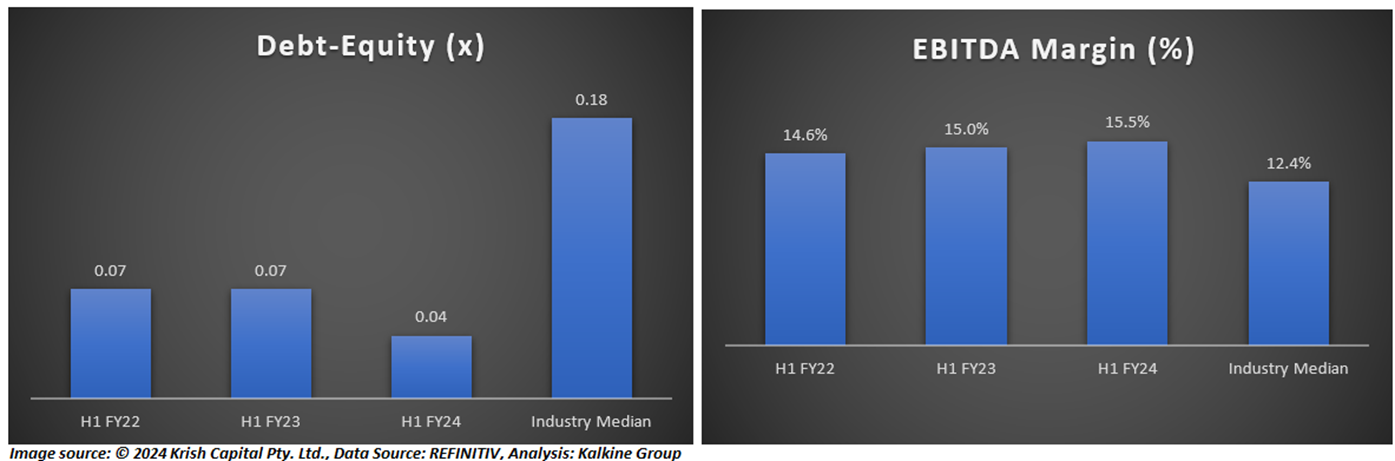
- SDG had a net cash balance of £16.2 million at 31 January 2024, compared to £15.4 million at the end of FY23.
- Its statutory profit after tax grew to £4.70 million in H1 FY24, marking a 11.9% YoY increase on the previous corresponding period.
Sanderson Design Group PLC (LSE: SDG), a luxury interior furnishings company listed on the FTSE AIM All-Share index, specializes in designing and manufacturing wallpapers and fabrics. Recently, the company’s Morris & Co. brand inked a licensing agreement with ENVOGUE International.
In the first half of FY24, SDG’s statutory profit after tax registered a 11.9% year-on-year (YoY) rise. The company has amplified its focus on its Licensing division matching the overall brands and manufacturing activities and compelling profitability. SDG hada net cash balance of £16.2 million at 31 January 2024, compared to £15.4 million at the end of FY23. Its statutory profit after tax grew to £4.70 million in H1 FY24, marking a 11.9% YoY increase on pcp.
However, its top-line business dropped marginally in H1 FY24, following a challenging market in the United Kingdom. While its sales declined 3.1% YoY to £108.5 million in FY24, it is noteworthy that SDG secured ~£10 million of Group sales from high-margin licensing for the first time.
SDG paid an interim dividend of 0.75 pence per share in November 2023, with an ex-dividend date of 19 October 2023.
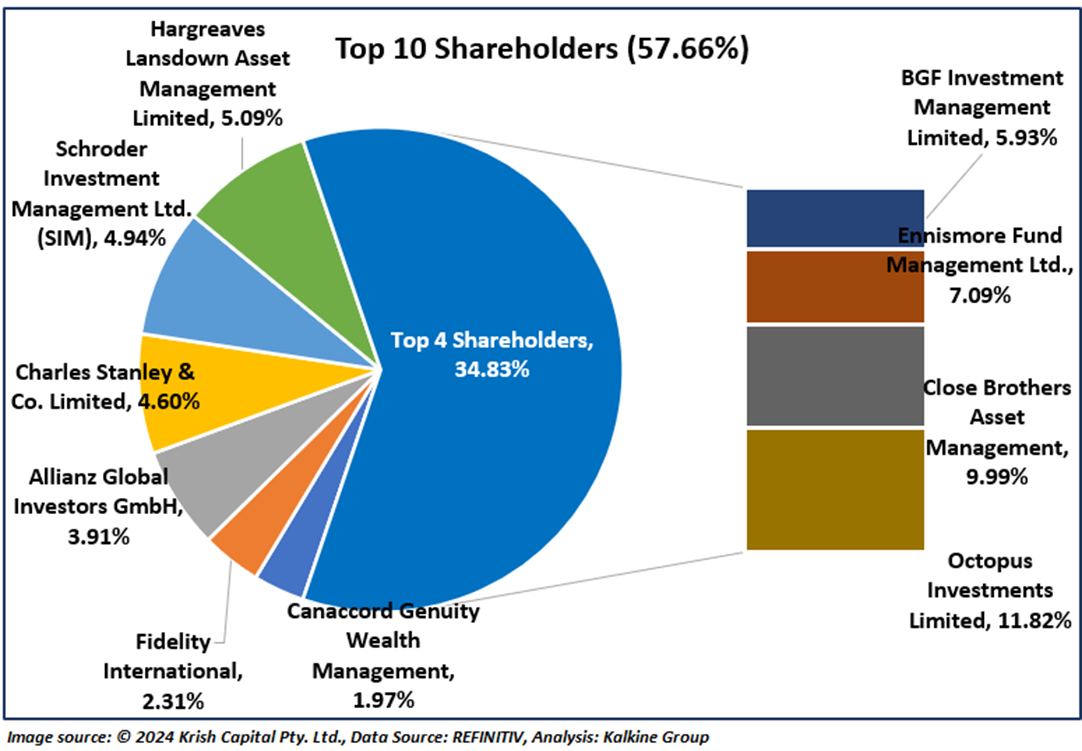
Top 10 Shareholders:
Around 57.66% of the total shareholdings is held by the top 10 shareholders of the company. While Octopus Investments Limited is the biggest shareholder with over 11.82% shareholding, Close Brothers Asset Management is the second biggest shareholder with around 9.99% shareholding.
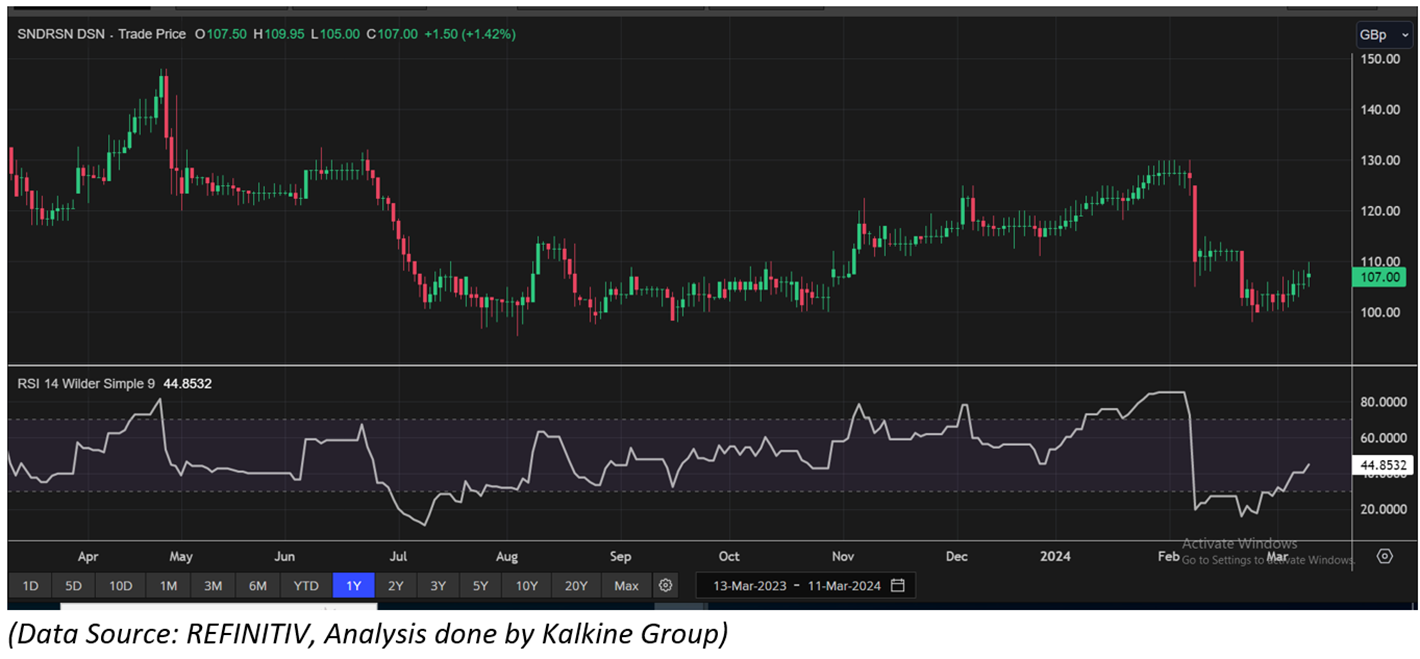
Stock Price Performance
SDG’s stock price has dropped 5.41% in the last one month. It has risen by 0.48% in the past six months. The stock’s 52-week low and 52-week high price stand at GBX 95.31 and GBX 148.00, respectively.
Note 1: Past performance is not a reliable indicator of future performance.
Note 2: The reference data for all price data, currency, technical indicators, support, and resistance levels is 11 March 2024. The reference data in this report has been partly sourced from EODHD/Others.


 Please wait processing your request...