Company Overview: Auto Trader Group PLC (LON: AUTO) is a United Kingdom-based automotive marketplace. The Company operates through two segments: Auto Trader, and Autorama. Man Group PLC (LON: EMG) is an FTSE-250 index-listed Investment Management Company, that focuses on generating attractive performance and client portfolio solutions. This Report covers the Investment Highlights, Conclusion, and Recommendation on the stock. This Report covers the Price Action and Technical Indicators Analysis along with the Target Levels, Stop Loss, Support Levels, Resistance Levels, and Recommendations on these two stocks.
FTSE All-Share Index (.FTAS) Market Round-Up
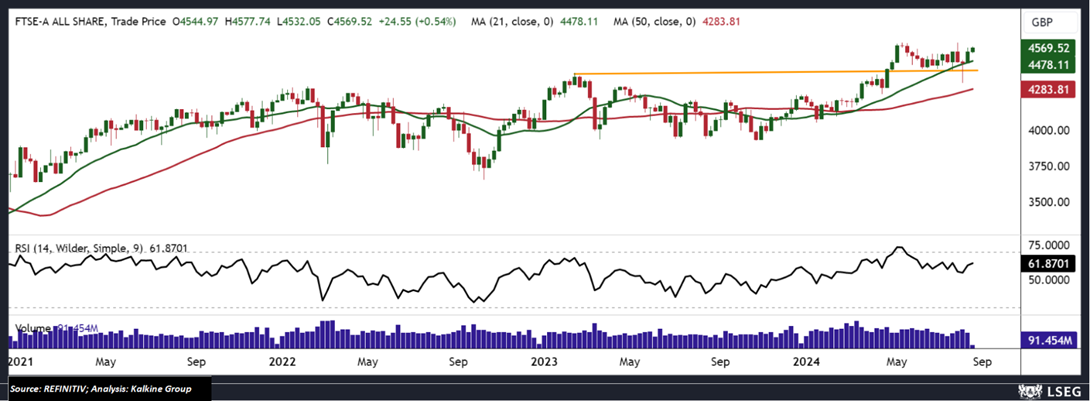
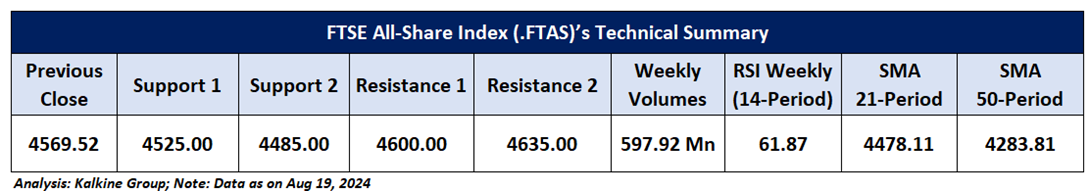
The FTSE All-Share Index, following a strong week, is showing a bullish trend, buoyed by positive sentiment from Asian and U.S. markets. The index is trading above its horizontal support zone and the 21-period Simple Moving Average (SMA), signalling potential continued gains. The Relative Strength Index (RSI) is at 61.87, indicating growing buying interest. Furthermore, the index is positioned above both the 21-period and 50-period SMAs, suggesting robust support at these levels. The technical indicators point to a favourable outlook for further upward movement.
Global Markets Wrap-Up
Wall Street witnessed positive movement last week, where the S&P 500 settled at 5554.21 with a gain of 3.931 percent, while the NASDAQ Composite Index settled at 17631.72 with a gain of 5.294 percent for the week ending August 16, 2024.
Having understood the US market performance over the past week, taking cues from major global news, and based on technical analysis of the FTSE All-Share Index (.FTAS) for the upcoming week, now have a look at the two LSE-listed.
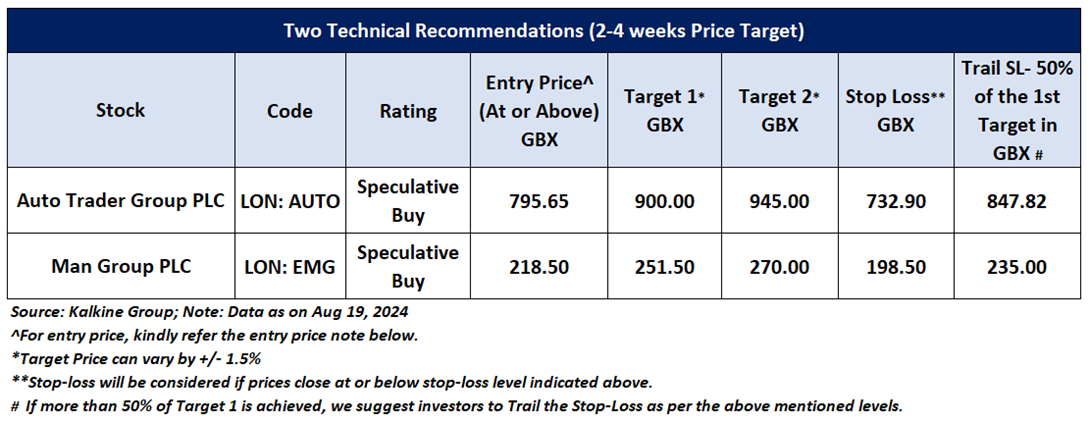
stocks pick from the technical analysis standpoint. Noted below are the recommendations based on entry price, target prices, and stop-loss Auto Trader Group PLC (LON: AUTO) and Man Group PLC (LON: EMG) for the next 2-4 weeks duration:
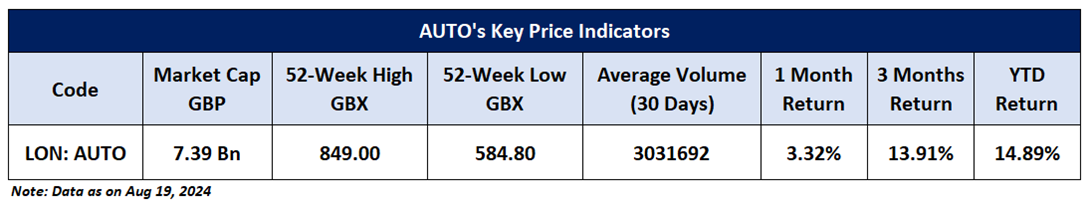
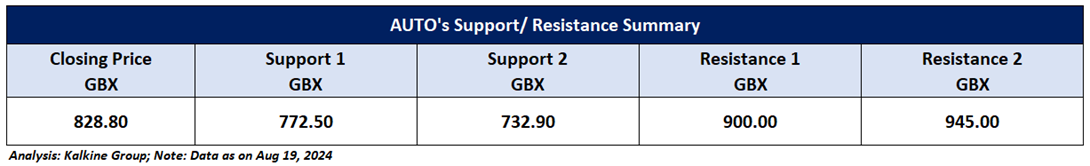
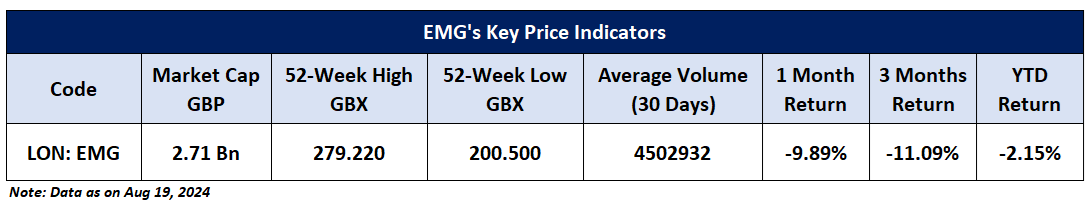
Auto Trader Group PLC (LON: AUTO) Noted below are the key price indicators for the recommended stock:
Price Action Analysis (on the Weekly Chart)
On the weekly chart, AUTO displays encouraging bullish signals. The stock is trading above a crucial horizontal support zone, suggesting positive momentum. This bullish outlook is reinforced by rising trading volumes and a strong RSI reading of 64.69. Key resistance levels to watch are at GBX 900.00 and GBX 945.00. If the upward trend persists, AUTO may test these resistance levels within the next 2-4 weeks, potentially paving the way for further gains.
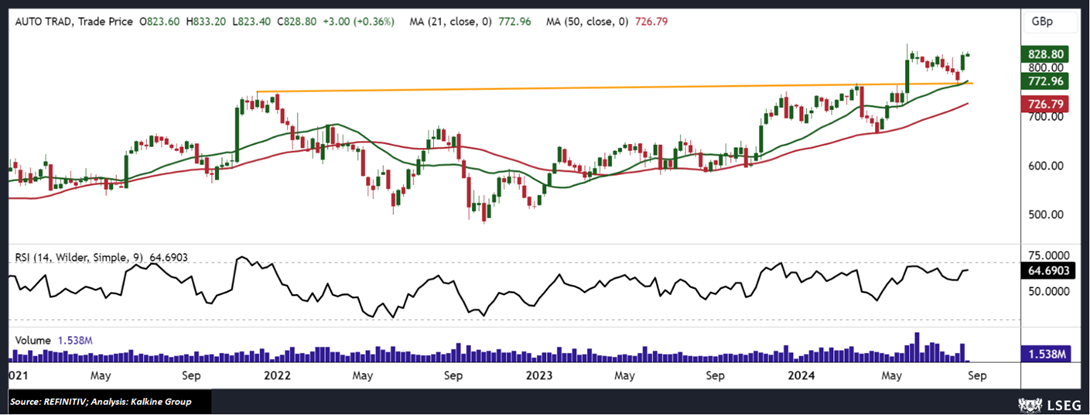
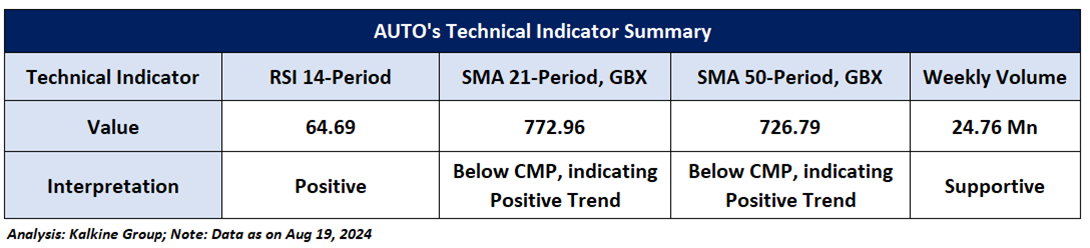
Technical Indicators Analysis (On the Weekly Chart)
The RSI moving in the positive zone with a reading of 64.69 suggests that the stock has some bullish momentum, supported by volumes indicating increased trading activity. The CMP is trading above the trend-following indicators 21-period & 50-period SMAs and may act as a small support level.
General Recommendation:
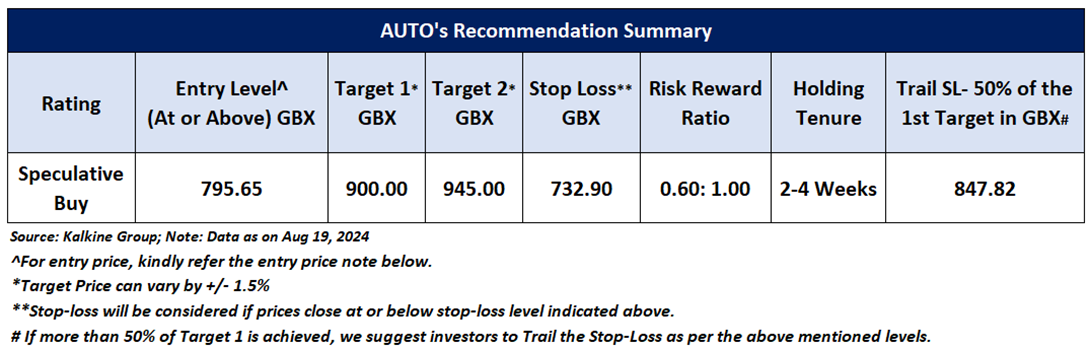
As per the above-mentioned price action and technical indicators analysis, Auto Trader Group PLC is looking technically well-placed on the chart, and a ‘Speculative Buy’ recommendation has been given on the stock. Investment decisions should be made depending on an individual’s appetite for upside potential, risks, and any previous holdings. This recommendation is purely based on technical analysis, and fundamental analysis has not been considered in this report. The summary of recommendation is as follow:
Man Group PLC (LON: EMG)
Price Action Analysis (on the Weekly Chart)
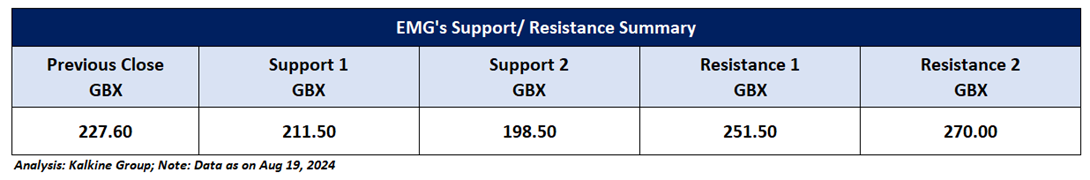
On the weekly chart, EMG is indicating potential bearish reversal signs, despite trading above a key horizontal support level. The formation of a green bullish candle last week suggests some positive momentum. This is supported by increasing trading volumes and a robust RSI. Key resistance levels to monitor are GBX 251.50 and GBX 270. Should the upward trend continue, the stock might approach these resistance points within the next 2-4 weeks. Tracking these indicators closely could reveal potential trading opportunities.
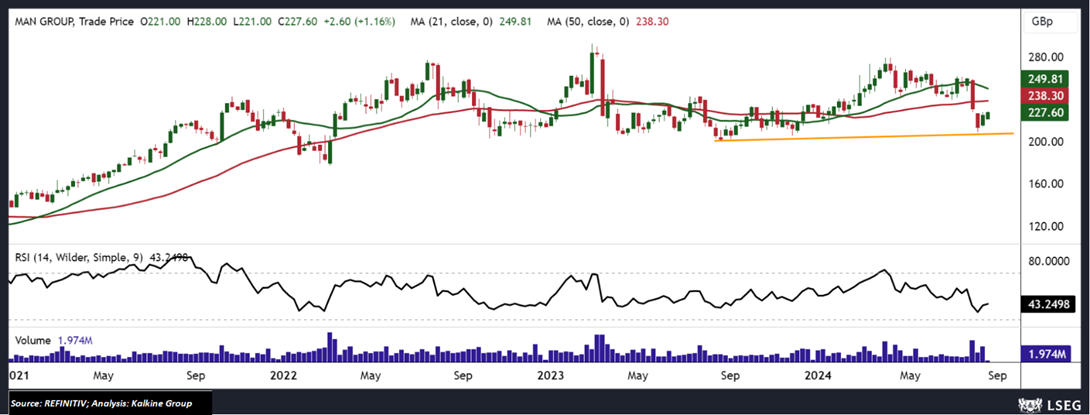
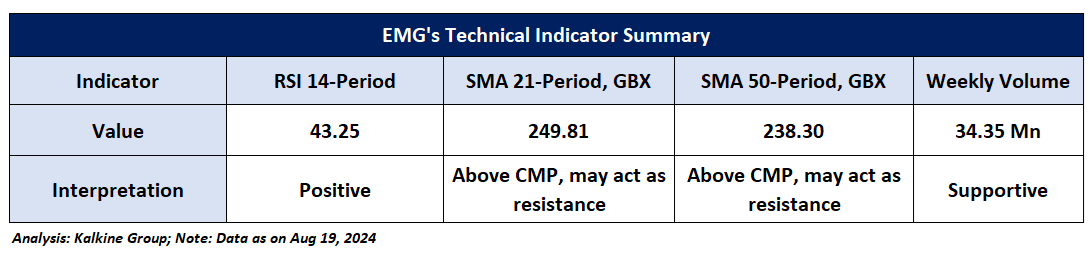
Technical Indicators Analysis (On the Weekly Chart)
On the weekly chart, the RSI (14-Period) is moving from the bearish zone into the positive zone, currently at 43.25, indicating moderate bullish momentum. Supporting this view, trading volumes suggest potential for an upside. However, the market price is currently below both the 50-period and 21-period SMAs, which are serving as short-term resistance levels. Despite these resistances, the overall sentiment remains positive, suggesting that a breakthrough could lead to short-term upward movement.
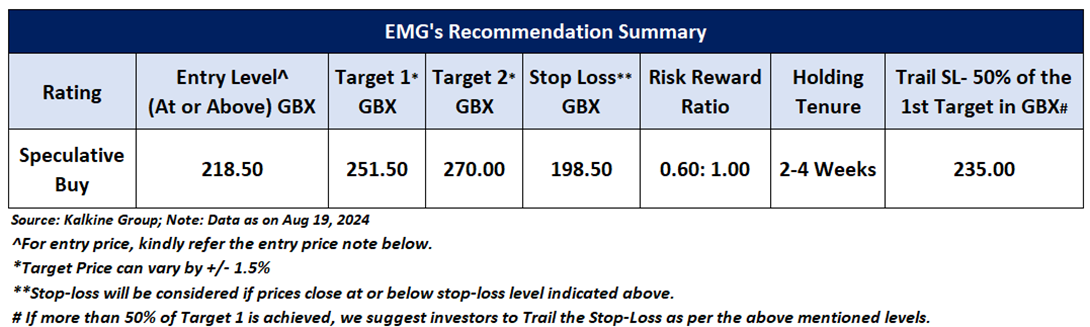
General Recommendation:
As per the above-mentioned price action and technical indicators analysis, Man Group PLC looking technically well-placed on the chart, and a ‘Speculative Buy’ recommendation has been given on the stock. Investment decisions should be made depending on an individual’s appetite for upside potential, risks, and any previous holdings. This recommendation is purely based on technical analysis, and fundamental analysis has not been considered in this report. The summary of recommendation is as follow:
Markets are trading in a highly volatile zone currently due to certain macro-economic and geopolitical tensions prevailing. Therefore, it is prudent to follow a cautious approach while investing.
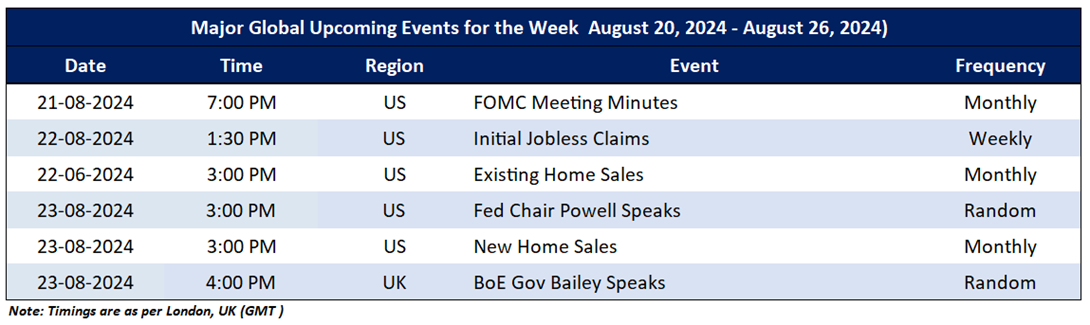
Upcoming Major Global Economic Events
Market events occur on a day-to-day basis depending on the frequency of the data and generally include an update on employment, inflation, GDP, consumer sentiments, etc. Noted below are the upcoming week's major global economic events that could impact the FTSE All-Share Index and listed stocks’ prices.
Related Risks: This report may be looked at from a high-risk perspective and recommendations are provided for a short duration. Recommendations provided in this report are solely based on technical parameters, and the fundamental performance of the stocks has not been considered in the decision-making process. Other factors which could impact stock prices include market risks, regulatory risks, interest rates risks, currency risks, social and political instability risks, etc.
Note 1: Individuals can consider exiting from the stock if the Target Price mentioned as per the technical analysis has been achieved and subject to the factors discussed above.
Note 2: How to Read the Charts?
The Green colour line reflects the 21-period moving average while the red line indicates the 50-period moving average. SMA helps to identify existing price trends. If the prices are trading above the 21-period and 50-period moving average, then it shows prices are currently trading in a bullish trend.
The Black colour line in the chart’s lower segment reflects the Relative Strength Index (14-Period) which indicates price momentum and signals momentum in trend. A reading of 70 or above suggests overbought status while a reading of 30 or below suggests an oversold status.
The Blue colour bars in the chart’s lower segment show the volume of the stock. The volume is the number of shares that changed hands during a given day. Stocks with high volumes are more liquid than stocks with lesser volume and liquidity in stocks helps in easier and faster execution of the order.
The Orange colour lines are the trend lines drawn by connecting two or more price points and used for trend identification purposes. The trend line also acts as a line of support and resistance.
Technical Indicators Defined: -
Support: A level at which the stock prices tend to find support if they are falling, and a downtrend may take a pause backed by demand or buying interest. Support 1 refers to the nearby support level for the stock and if the price breaches the level, then Support 2 may act as the crucial support level for the stock.
Resistance: A level at which the stock prices tend to find resistance when they are rising, and an uptrend may take a pause due to profit booking or selling interest. Resistance 1 refers to the nearby resistance level for the stock and if the price surpasses the level, then Resistance 2 may act as the crucial resistance level for the stock.
Stop-loss: In general, it is a level to protect further losses in case of unfavorable movement in the stock prices.
Risk Reward Ratio: Risk reward ratio is the difference between an entry point to a stop loss and profit level. This report is based on ~60% Stop Loss of the Target 1 from the entry point.
A trailing stop-loss is a modification of stop-loss in case of favourable movement in the price to protect the gains. Individuals can Trail the Stop-Loss as per the aforementioned levels if the stock price achieves more than 50% of the Target 1. Individuals should consider exiting from the position as per the Trailing Stop-Loss level if the price starts moving downwards after achieving more than 50% of the Target 1.
The reference date for all price data, currency, technical indicators, support, and resistance levels is August 19, 2024. The reference data in this report has been partly sourced from REFINITIV.
Abbreviations
CMP: Current Market Price
SMA: Simple Moving Average
GBP: British pound sterling
GBX: British pence sterling
RSI: Relative Strength Index
Note: Trading decisions require a thorough analysis by individuals. Technical reports in general chart out metrics that may be assessed by individuals before any stock evaluation. The above are illustrative analytical factors used for evaluating stocks; other parameters can be looked at along with additional risks per se. Past performance is neither an indicator nor a guarantee of future performance.
Past performance is not a reliable indicator of future performance.

 Please wait processing your request...