Company Overview: Haleon PLC (LON: HLN) is a consumer healthcare company. The Company's product portfolio includes five categories, including oral health, vitamins, minerals, and supplements (VMS), pain relief, respiratory health, digestive health and others. The Company’s geographical segments include North America, Europe, Middle East, Africa, and Latin America (EMEA and LatAm, and Asia Pacific (APAC). This Report covers the Price Action and Technical Indicators Analysis along with the Target Levels, Stop Loss, Support Levels, Resistance Levels, and Recommendations on the stock.
FTSE All-Share Index (.FTAS) Market Round-Up
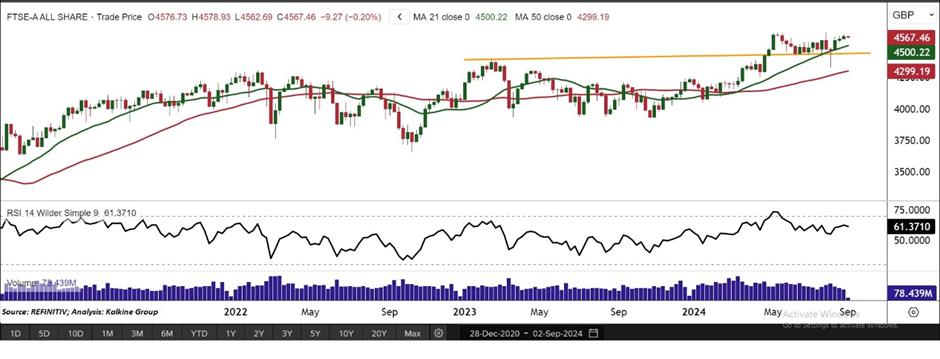
Last week, the FTSE All-Share Index (.FTAS) demonstrated a positive trend, beginning at 4557.24 and climbing to a peak of 4594.67 before closing at 4576.73, marking a modest increase of 0.42%. The index's steady performance was bolstered by strong corporate earnings and favourable global market sentiment. Despite experiencing some fluctuations, the overall movement reflected stability and a generally optimistic outlook throughout the week.
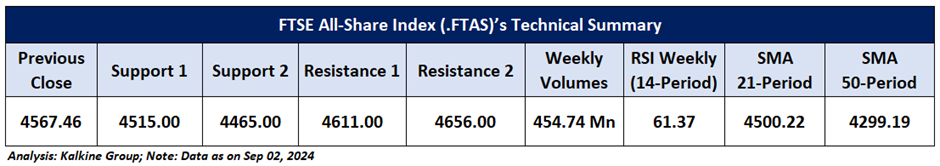
Last week, the FTSE All-Share Index demonstrated strong momentum, despite various global events impacting markets. It continues to follow a bullish trend, trading above key support levels, which suggests the potential for ongoing gains. The 14-period RSI is rising at 61.37, reinforcing the positive sentiment. Furthermore, with the index positioned above the 50-period SMA, these levels may act as crucial support, enhancing the likelihood of sustained upward movement. Overall, the technical indicators support a favourable outlook for continued growth in the index.
Global Markets Wrap-Up
Wall Street indices inched lower in the last week and settled on a positive note. Notably, the S&P 500 settled at 5648.40 with a gain of ~0.24%, while NASDAQ Composite Index settled at 17713.62 with a loss of ~0.92% for the week ending August 30, 2024. The seasonally adjusted initial US unemployment insurance claims data published by the US Department of Labor decreased by 2k to 231k for the week ending 24 August 2024 against the revised Unemployment Insurance Claims at 233k in the prior week.
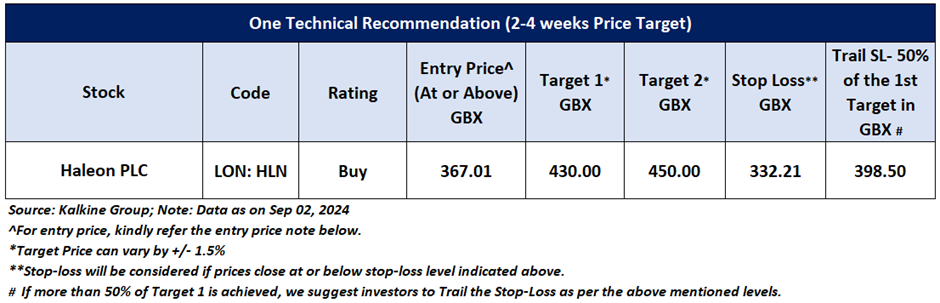
Having understood the US market performance over the past week, taking cues from major global news, and based on technical analysis of the FTSE All-Share Index (.FTAS) for the upcoming week, now have a look at the one LSE-listed stock pick from the technical analysis standpoint. Noted below are the recommendations based on entry price, target prices, and stop-loss for Haleon PLC (LON: HLN) for the next 2-4 weeks duration:
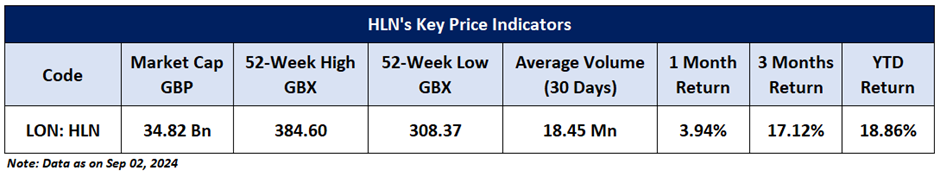
Haleon PLC (LON: HLN) Noted below are the key price indicators for the recommended stock:
Price Action Analysis (on the Daily Chart)
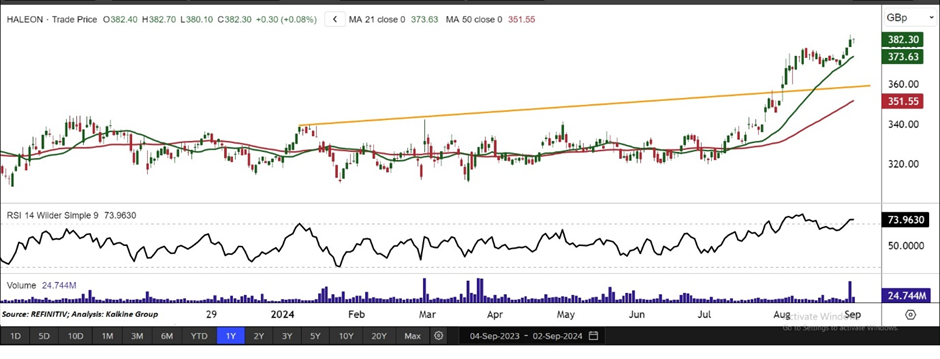
HLN's daily chart shows prices trading above the key horizontal trendline support, signalling the potential for further gains. The stock has consistently held above this support level, suggesting a favourable outlook for additional upside. In the coming 2-4 weeks, the stock will encounter a critical resistance at GBX 430.00. A successful breach of this resistance could trigger increased buying activity, potentially propelling the stock and maintaining a strong upward trajectory.
Technical Indicators Analysis (On the Daily Chart)
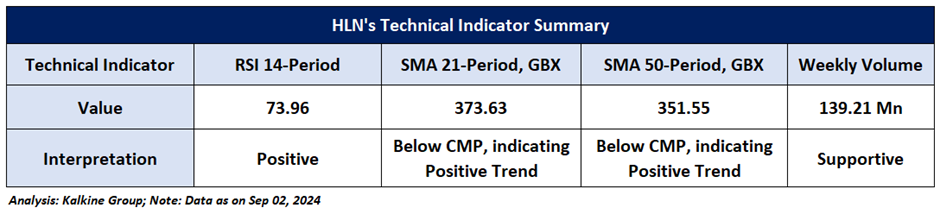
On the Daily chart, the RSI 14-Period (Relative Strength Indicator) is currently situated in the Support zone with a reading of 73.96. Moreover, the volumes support an upside movement. The current market price (CMP) is trading above the trend-following indicators, the 21-period SMA and the 50-period SMA which may act as small support levels.
General Recommendation:
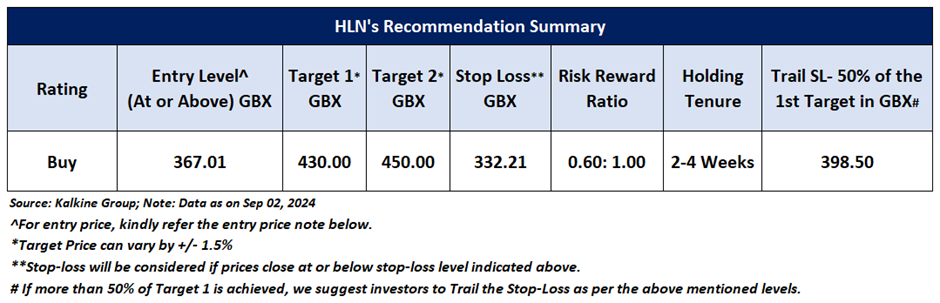
As per the above-mentioned price action and technical indicators analysis, Haleon PLC is looking technically well-placed on the chart, and a ‘Buy’ recommendation has been given on the stock. Investment decisions should be made depending on an individual’s appetite for upside potential, risks, and any previous holdings. This recommendation is purely based on technical analysis, and fundamental analysis has not been considered in this report. The summary of recommendations is as follows:
Markets are trading in a highly volatile zone currently due to certain macro-economic and geopolitical tensions prevailing. Therefore, it is prudent to follow a cautious approach while investing.
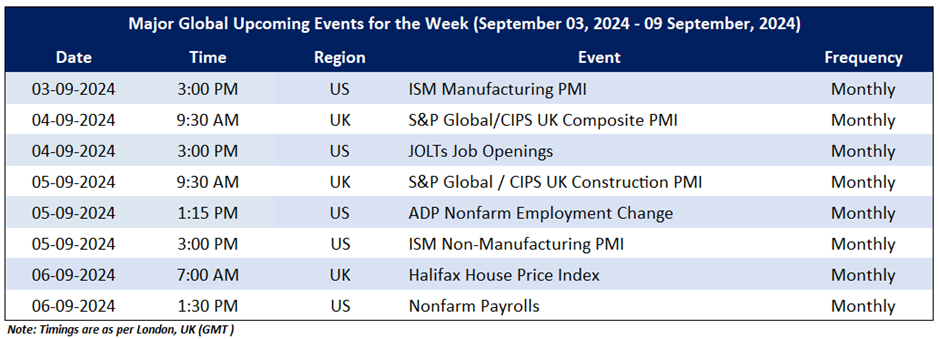
Upcoming Major Global Economic Events
Market events occur on a day-to-day basis depending on the frequency of the data and include an update on employment, inflation, GDP, consumer sentiments, etc. Noted below are the upcoming week's major global economic events that could impact the FTSE All-Share Index and listed stocks’ prices.
Related Risks: This report may be looked at from a high-risk perspective and recommendations are provided for a short duration. Recommendations provided in this report are solely based on technical parameters, and the fundamental performance of the stocks has not been considered in the decision-making process. Other factors which could impact stock prices include market risks, regulatory risks, interest rate risks, currency risks, social and political instability risks, etc.
Note 1: Individuals can consider exiting from the stock if the Target Price mentioned as per the technical analysis has been achieved and subject to the factors discussed above.
Note 2: How to Read the Charts?
The Green color line reflects the 21-period moving average while the red line indicates the 50-period moving average. SMA helps to identify existing price trends. If the prices are trading above the 21-period and 50-period moving average, then it shows prices are currently trading in a bullish trend.
The Black color line in the chart’s lower segment reflects the Relative Strength Index (14-Period) which indicates price momentum and signals momentum in trend. A reading of 70 or above suggests overbought status while a reading of 30 or below suggests an oversold status.
The Blue color bars in the chart’s lower segment show the volume of the stock. The volume is the number of shares that changed hands during a given day. Stocks with high volumes are more liquid than stocks with lesser volume and liquidity in stocks helps in easier and faster execution of the order.
The Orange color lines are the trend lines drawn by connecting two or more price points and used for trend identification purposes. The trend line also acts as a line of support and resistance.
Technical Indicators Defined: -
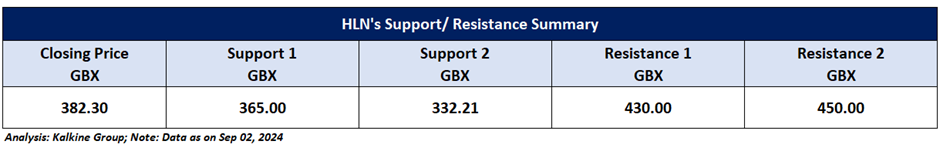
Support: A level at which the stock prices tend to find support if they are falling, and a downtrend may take a pause backed by demand or buying interest. Support 1 refers to the nearby support level for the stock and if the price breaches the level, then Support 2 may act as the crucial support level for the stock.
Resistance: A level at which the stock prices tend to find resistance when they are rising, and an uptrend may take a pause due to profit booking or selling interest. Resistance 1 refers to the nearby resistance level for the stock and if the price surpasses the level, then Resistance 2 may act as the crucial resistance level for the stock.
Stop-loss: In general, it is a level to protect further losses in case of unfavorable movement in the stock prices.
Risk Reward Ratio: Risk reward ratio is the difference between an entry point to a stop loss and profit level. This report is based on ~60% Stop Loss of the Target 1 from the entry point.
A trailing stop-loss is a modification of stop-loss in case of favourable movement in the price to protect the gains. Individuals can Trail the Stop-Loss as per the aforementioned levels if the stock price achieves more than 50% of the Target 1. Individuals should consider exiting from the position as per the Trailing Stop-Loss level if the price starts moving downwards after achieving more than 50% of the Target 1.
The reference date for all price data, currency, technical indicators, support, and resistance levels is September 02, 2024. The reference data in this report has been partly sourced from REFINITIV.
Abbreviations
CMP: Current Market Price
SMA: Simple Moving Average
GBP: British pound sterling
GBX: British pence sterling
RSI: Relative Strength Index
Note: Trading decisions require a thorough analysis by individuals. Technical reports in general chart out metrics that may be assessed by individuals before any stock evaluation. The above are illustrative analytical factors used for evaluating stocks; other parameters can be looked at along with additional risks per se. Past performance is neither an indicator nor a guarantee of future performance.
Past performance is not a reliable indicator of future performance.
 Please wait processing your request...