Crypto Market Round-Up
Typically, cryptocurrencies are termed as digital currencies and use blockchain technology to record every transaction. The Sandbox (SAND) is a decentralized virtual gaming world built on the Ethereum blockchain that allows users to create, own, and monetize their gaming experiences. It is part of the broader category of play-to-earn (P2E) games and virtual worlds that incorporate blockchain technology, non-fungible tokens (NFTs), and cryptocurrency to offer players new ways to engage with games and virtual assets. SAND has a market capitalization of ~USD 2.15 billion (as per TradingView as of December 05, 2024).
Last week, the benchmark S&P Cryptocurrency Broad Digital Market (BDM) Index started on a positive note and maintained a bullish momentum for the entire week. The index advanced by 118.41 points (~1.97%) to 6140.47 for the week ending November 29, 2024. In the current week starting December 02, 2024, the index is trading with positive momentum. Moreover, other major cryptocurrencies, such as Bitcoin and Ethereum, are witnessing bullish momentum for the current week.
Having understood the S&P Cryptocurrency BDM Index movement over the last week and the scenario for the upcoming week, one crypto that seems ‘Bullish’ at the current level appears to be The Sandbox (SAND) based on the below technical parameters: -
The Sandbox (SAND):
Noted below are the generic insights, indicative entry price, support levels, and resistance for the next 1-2 weeks duration for the SAND:
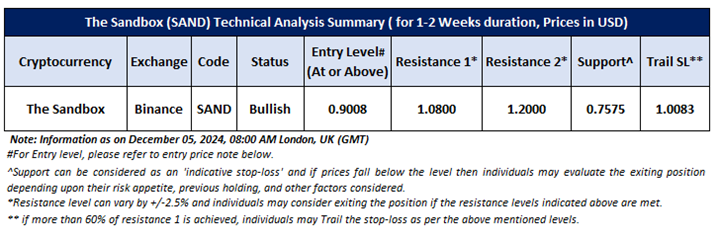
Entry level and Resistance Levels as mentioned herein are only indicative in nature as per trend analysis and further evaluation is required when looking at cryptocurrency under discussion.
Note: The reference Information in this report has been sourced from TradingView.
SAND Technical Analysis Summary (On the Weekly Chart):
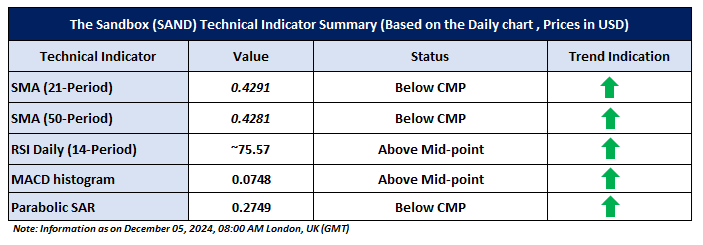
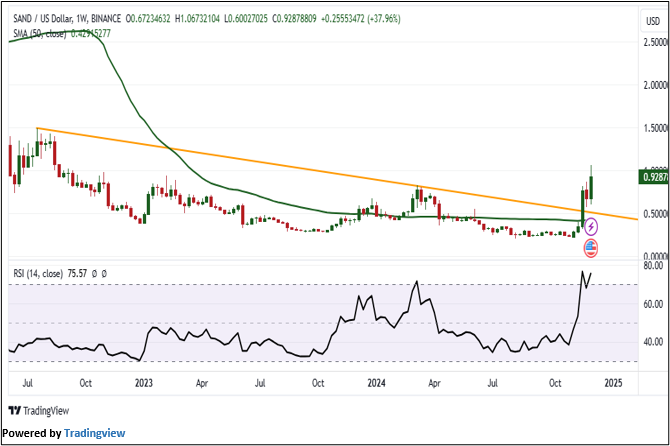
On the weekly chart, SAND’s prices are trading above the falling trendline breakout level at the USD 0.5878 level and taking support from the trendline, indicating positive bias in the price action. Moreover, the leading indicator RSI (14-period) is showing a reading of ~75.57 level, indicating positive momentum. Further, the prices are trading above the trend-following indicator 21-period SMA, which may act as a support level.
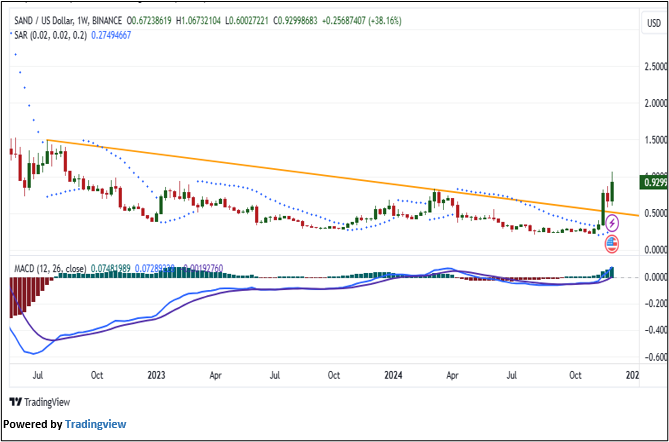
The momentum indicator MACD histogram is trading above the centerline, supporting a positive stance. Further, the prices are trading above the Parabolic SAR indicator, which may act as a support level. Now the next resistance level appears to be at USD 1.08, and prices may test this level in the coming sessions (1-2 weeks).
Noted below are the illustrative points as key positives and risks when looking at The Sandbox (SAND) in the cryptocurrency space:-
Illustrative points as Positives:
- Decentralized Ownership: Players have full ownership of the assets they create, buy, or sell. The use of NFTs ensures that land, characters, and items are truly owned by the users, allowing for proof of ownership, scarcity, and a secondary market.
- User-Generated Content: The Sandbox encourages creativity by allowing players to create and monetize their own content. Anyone can design voxel-based assets, game experiences, or entire worlds, offering huge potential for creators and developers.
Illustrative points as Risks:
- High Barrier to Entry: Purchasing virtual land or assets in the Sandbox can be expensive, particularly as the demand for popular plots increases. Additionally, creating high-quality content requires skill and time to learn tools like VoxEdit, which may deter some potential users.
- Scalability Issues: Being built on the Ethereum blockchain, Sandbox inherits some of the scalability challenges faced by Ethereum, including high transaction fees during times of network congestion. This could make small transactions (like buying minor in-game items) less affordable for players.
Conclusion:
Based on the above-mentioned price action analysis and technical indicators outlook, The Sandbox (SAND) may witness movement in the upside direction. The trend looks to be in an interesting space and the currency looks ‘Bullish’ given the current price of USD 0.9287 (as on December 05, 2024, at 08:00 AM, (GMT) Time in London, UK. However, volatility in the price should be borne in mind when looking at further evaluation for investment scenarios. Markets are trading in a highly volatile zone currently due to certain macro-economic issues and geopolitical tensions prevailing. Therefore, it is prudent to follow a cautious approach while making investment decisions.
Related Risks: Based on the technical analysis, the risks are defined as per risk-reward ratio (~0.80:1.00), however, returns are generated within 1-2 weeks’ time frame. This report may be looked at from high-risk perspective and recommendations are provided are for a short duration. Recommendations provided in this report are solely based on technical parameters, and the fundamental performance of the cryptocurrency has not been considered in the decision-making process. Other factors which could impact the cryptocurrency prices include market risks, regulatory risks, interest rates risks, currency risks, social and political instability risks etc.
Note 1: Trend Indications
Bullish Trend is generally used in information services and financial reporting as a trend typified with an upward momentum in prices based on the market sentiments, overall price action, and technical analysis. Typically, Resistance Levels or Indicative Stop loss levels need to be evaluated for exit triggers.
Bearish Trend is generally used in information services and financial reporting as a trend typified with a downward movement in prices based on the market sentiments, overall price action, and technical analysis. Typically, Support Levels or Indicative Stop loss levels need to be evaluated for exit triggers.
When we identify trends as ‘Bullish’ or ‘Bearish’ it is based on a technical analysis of the available data as we understand it and is not, and should not be considered as, either advice or a recommendation to buy, sell or hold the relevant cryptoassets.
Note 2: How to Read the Chart?
The Green colour line reflects the 21-period simple moving average (SMA) while the red line indicates the 50-period SMA. SMA helps to identify existing price trends and if the prices trade above the 21-period and 50-period SMA, then in general it shows an uptrend trend.
The Black colour line in the chart’s lower segment is a 14-period Relative Strength Index (RSI) which indicates momentum in trend. A reading of 70 or above suggests overbought status, while a reading of 30 or below suggests an oversold status.
The Blue colour bars in the chart’s lower segment show the volume of the Cryptocurrency. The volume is the quantity that changed hands during the given period. Cryptocurrencies with high volumes are more liquid compared to lesser once and higher volumes help in easier and faster execution of the order.
The Orange colour lines are the trend lines drawn by connecting two or more price points and used for trend identification purposes. The trend line also acts as a line of support and resistance.
Technical Indicators Defined: -
Support: A level at which the Cryptocurrency prices tend to find support if they are falling, and a downtrend may take a pause backed by demand or buying interest. Support 1 refers to the nearby support level for the Cryptocurrency and if the price breaches the level, then Support 2 may act as the crucial support level for the Cryptocurrency.
Resistance: A level at which the Cryptocurrency prices tend to find resistance when they are rising, and an uptrend may take a pause due to profit booking or selling interest. Resistance 1 refers to the nearby resistance level for the Cryptocurrency and if the price surpasses the level, then Resistance 2 may act as the crucial resistance level for the Cryptocurrency.
Stop-loss: It is a level to protect further losses in case of unfavourable movement in the Cryptocurrency prices.
A trailing stop-loss is a modification of stop-loss in case of favourable movement in the price to protect the gains. It is suggested to Trail the Stop-Loss as per the aforementioned levels if the Cryptocurrency price achieves more than 60% of the Resistance 1. individuals, in general, might consider exiting from the position as per the Trailing Stop-Loss level if the price starts moving downwards after achieving more than 60% of Resistance 1. However, these indications need further evaluation basis associated risks and any change in trends.
The reference date for all price data, currency, technical indicators, support, and resistance levels is December 05, 2024 at 08:00 AM, (GMT) Time in London, UK. The S&P Cryptocurrency BDM Index in this report has been sourced from REFINITIV.
Abbreviations
CMP: Current Market Price
SMA: Simple Moving Average
RSI: Relative Strength Index
USD: United States dollar
Note: This publication is for informational purposes only based on technical analysis and does not reflect the fundamental validity of the cryptoasset. It in no way constitutes investment advice or a recommendation to buy, sell or hold financial instruments. Trading decisions require a thorough analysis by investors taking account of a range of factors, including in relation to cryptoassets in themselves, general market trends and an investor’s own ability and appetite to take risks and bear losses. Past performance is neither an indicator nor a guarantee of future performance.
Disclaimer
References to ‘Kalkine’, ‘we’, ‘our’ and ‘us’ refer to Kalkine Limited.
This website is a service of Kalkine Limited. Kalkine Limited is a private limited company, incorporated in England and Wales with registration number 07903332. Kalkine Limited is authorised and regulated by the Financial Conduct Authority under reference number 579414.
No information, whether oral or written, obtained by you from us or through or from the service shall create any warranty not expressly stated. Kalkine does not intend to exclude any liability which it is not permitted to exclude under applicable law or regulation.
Any information in this report relating to digital currency or other cryptoasset types (cryptoassets) is based on the law that applied at the time the report was prepared. The laws that apply to cryptoassets (and how a particular cryptoasset is regulated) may change. Investments in cryptoassets can be high risk and volatile. You should seek appropriate advice and consider your objectives and risk appetite before making any decision in relation to such products.
This publication does not offer financial advice based upon your personal financial situation or goals, and we shall NOT be held liable for any investment or trading losses you may incur by using any information contained in our publications, market updates, news alerts and corporate profiles. The information contained within this publication does not in any way endorse or recommend individuals, investment products or services for your personal financial situation. You should discuss your portfolios and the risk tolerance level appropriate for your personal financial situation with an authorised person specialising in advising on investments. You should be aware that the value of any investment is variable and can go down as well as up and you may not get back the amount invested. Past performance is not indicative of future results. You should also be aware that most cryptoassets are not regulated by the FCA and are not protected under the Financial Services Compensation Scheme or the Financial Ombudsman Service. Further, Capital Gains Tax (CGT) may be payable on profits made from investing in cryptoassets.
On the date of publishing this report (referred to on the Kalkine website), employees and/or associates of Kalkine and its related entities do not hold interests in any of the cryptoassets covered on the Kalkine website unless those persons comply with certain safeguards, procedures, and disclosures.
Past performance is not a reliable indicator of future performance.
 Please wait processing your request...