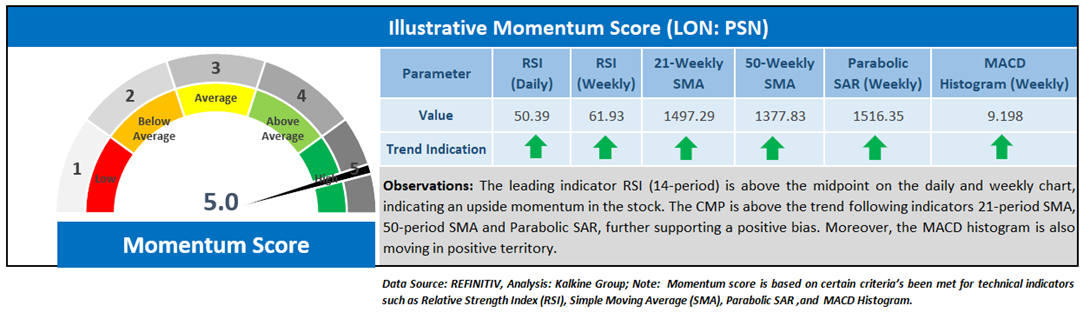
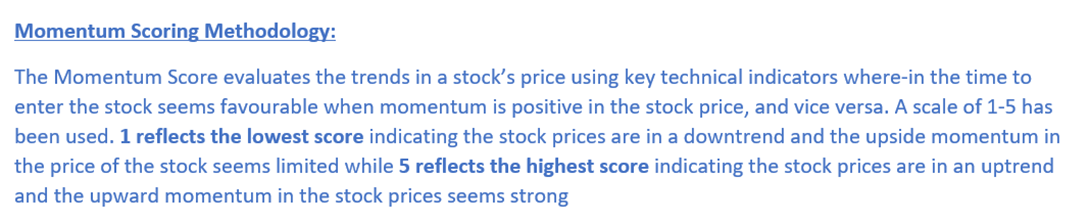
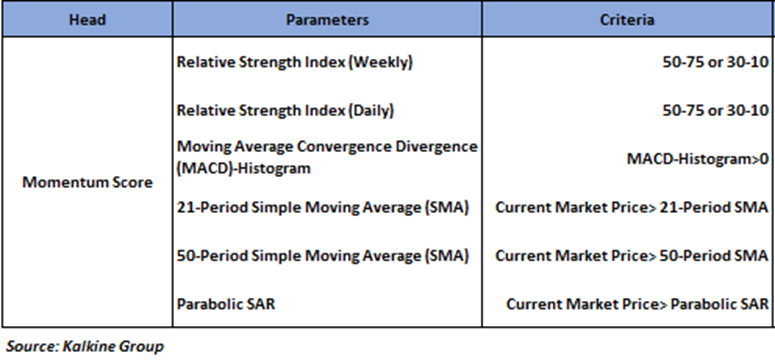
Company Overview: Persimmon PLC (LON: PSN) is a FTSE 100 listed United Kingdom-based housebuilder company. The company operates locally with 30 offices across the country and operates three off-site manufacturing facilities named Space4, Brickworks, and Tileworks. Persimmon PLC trades under the brand names of Persimmon Homes, Charles Church, and Westbury Partnerships. The report covers the Price Action and technical Indicators Analysis along with the Target Levels, Stop Loss, and Recommendation on this one stock. Noted below is the illustrative momentum score based on technical indicators for the stock:

Technical Observation (on the Weekly Chart)
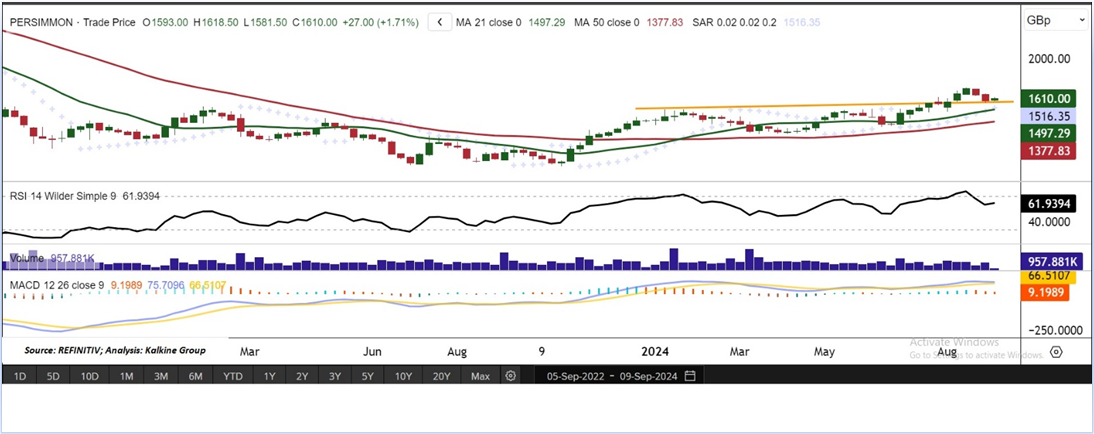
On the weekly charts, PSN's prices are trading above a horizontal trendline, signalling a potential continuation of upward momentum. This bullish outlook is supported by increased trading volumes. The Relative Strength Index (RSI) is 61.93, indicating sustained positive momentum. Additionally, the 21-period and 50-period Simple Moving Averages (SMAs) are below the Current Market Price (CMP), suggesting they may serve as support levels.
Conclusion
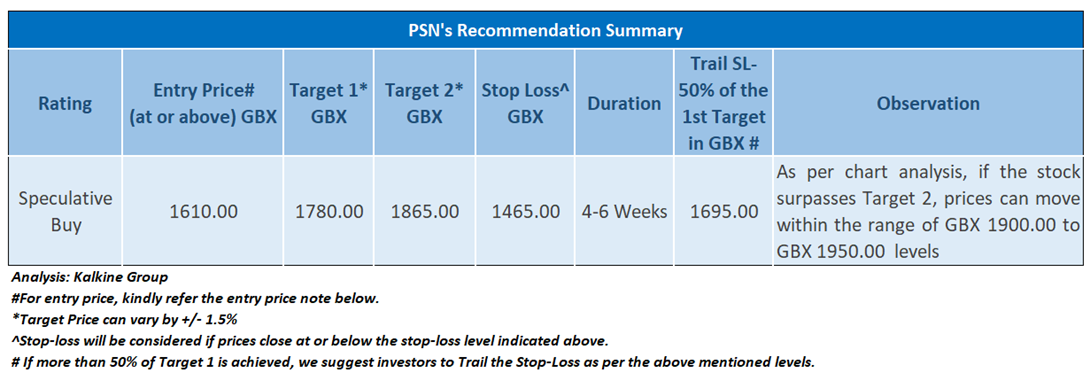
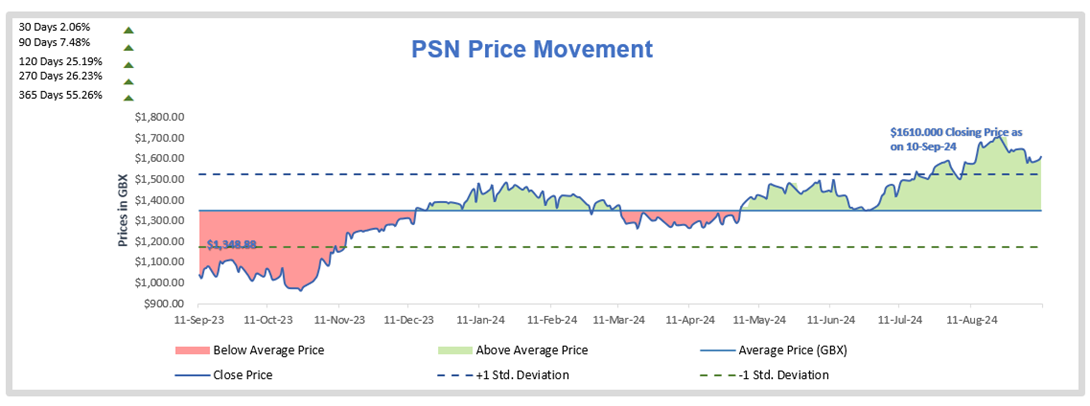
As per the above-mentioned price action and technical indicators analysis, a ‘Speculative Buy’ rating has been given on Persimmon PLC (LON: PSN) at the Closing Price of GBX 1610.00, as on 10th September 2024. Markets are trading in a highly volatile zone currently due to certain macroeconomic issues and prevailing geopolitical tensions. Therefore, it is prudent to follow a cautious approach while making investment decisions.

Note 1: Past performance is not a reliable indicator of future performance.
Note 2: Investment decisions should be made depending on an individual’s appetite for upside potential, risks, and any previous holdings. This recommendation is purely based on technical analysis, and fundamental analysis has not been considered in this report. Individuals can consider exiting from the stock if the Target Price or Stop loss mentioned as per the technical analysis has been achieved and is subject to the factors discussed above.
Note 3: Related Risks: This report may be looked at from a high-risk perspective and recommendations are provided for a short duration. Recommendations provided in this report are solely based on technical parameters, and the fundamental performance of the stocks has not been considered in the decision-making process. Other factors which could impact the stock prices include market risks, regulatory risks, interest rates risks, currency risks, social and political instability risks etc.
Note 4: The holding duration for recommendations is 4-6 weeks; however, an extension of further 2 weeks may be considered with an update report in case the opportunity looks technically well placed. The maximum holding duration is expected to be 8 weeks post which the position will be closed automatically in case no resistance, support and or stop loss levels are hit at the close price of the due date.
Note 5: How to Read the Charts?
The Green colour line reflects the 21-period moving average while the red line indicates the 50-period moving average. SMA helps to identify existing price trends. If the prices are trading above the 21-period and 50-period moving average, then it shows prices are currently trading in a bullish trend.
The Black colour line in the chart’s lower segment reflects the Relative Strength Index (14-Period) which indicates price momentum and signals momentum in trend. A reading of 70 or above suggests overbought status while a reading of 30 or below suggests an oversold status.
The Blue colour bars in the chart’s lower segment show the volume of the stock. The volume is the number of shares that changed hands during a given day. Stocks with high volumes are more liquid than stocks with lesser volume as liquidity in stocks helps in easier and faster execution of the order.
The Orange colour lines are the trend lines drawn by connecting two or more price points and used for trend identification purposes. The trend line also acts as a line of support and resistance.
Technical Indicators Defined: -
Stop-loss: In general, it is a level to protect further losses in case of unfavourable movement in the stock prices.
Parabolic SAR: Parabolic SAR is a trend-following indicator that acts as a trailing stop. If the price stops rising and reverses below SAR, it indicates the start of a downtrend with SAR above the price following like a trailing stop. Similarly, if the prices stop falling and move above SAR, it indicates the start of an uptrend with SAR below the price following like a trailing stop.
MACD-Histogram: Moving Average Convergence Divergence (MACD)-Histogram is the difference between the MACD and its signal line. A positive value of the MACD-Histogram indicates a positive crossover between MACD and its signal line, whereas a negative value indicates a negative crossover.
The reference date for all price data, currency, technical indicators, support, and resistance levels is as on 10th September 2024. The reference data in this report has been partly sourced from REFINITIV.
Abbreviations
CMP: Current Market Price
SMA: Simple Moving Average
GBP: British pound sterling
GBX: British pence sterling
RSI: Relative Strength Index
Note: Trading decisions require a thorough analysis by individuals. Technical reports in general chart out metrics that may be assessed by individuals before any stock evaluation. The above are illustrative analytical factors used for evaluating stocks; other parameters can be looked at along with additional risks per se. Past performance is neither an indicator nor a guarantee of future performance.
Past performance is not a reliable indicator of future performance.
 Please wait processing your request...