
Coca-Cola HBC AG
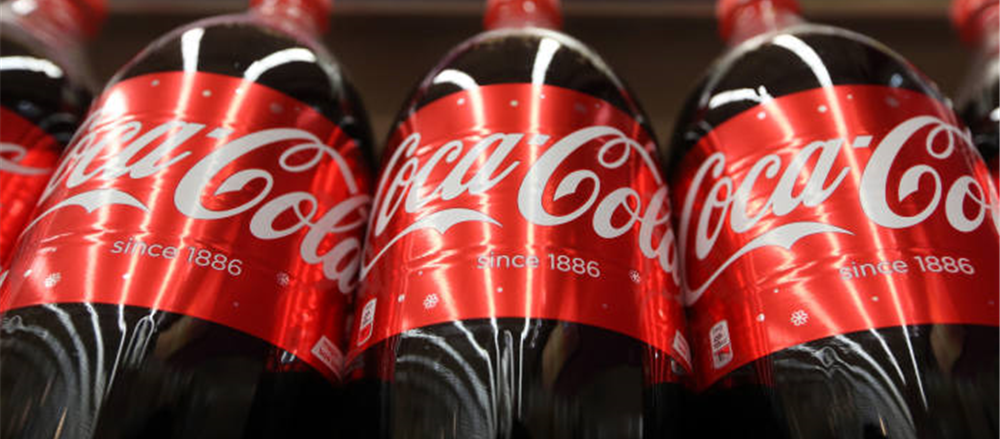
Switzerland based Coca Cola HBC AG is engaged in the business of production and distribution of non-alcoholic beverages. The company is a bottler of Coca Cola Products. The company distributes Coca-Cola, Coca-Cola Zero, Coca-Cola Light, Fanta, and Sprite as well as water, energy drinks and juice. Norges Bank Investment Management and Capital Research & Management Co.are the top institutional shareholders in the company. (Source: Thomson Reuters).
Proposed Deals
On February 21, 2019, the company has announced its intention to acquire Knjaz Milos AD, an Arandelovac- based producer of bottled water for an undisclosed amount. Also, the company has not disclosed how much stake they are going to acquire in Knjaz Milos AD. On February 18, 2019, Coca-Cola HBC AG announced to acquire 100 per cent stake in the Bambi and Pozarevac, a Pozarevac based producer of cookies and crackers from Mid Europe Partners LLP. The proposed deal will cost around USD$293.68 million.
Recent Updates
On April 09, 2019, the company has announced that it will report trading update for the quarter ended March 29, 2019, by May 02, 2019 at 07:00 PM GMT.
Financial Performance – FY18 (€mn)

Source: Annual Report, FY18
During FY18, net revenue surged by 2.1% (actual basis) to €6,657.1 mn and by 6.0% on a constant currency basis.During the last financial year, the company gotbenefited from product innovation, price surge and better package mix. The company reported volume growth of 4.2% with improvement in all segments led by Sparkling beverages. However, volume declined in Nigeria on account of intense competition. Comparable EBIT for FY18 surged by 9.6% to €680.7 mn and comparable EBIT margin improved marginally by 70 bps to 10.2%,driven by decent volume growth and revenue growth and 20 bps cut in operating expenses as a percentage of revenue. Comparable Net profit surged by 6.80% to €480.4 million. In FY18,Comparable reported earnings per share stood at €1.30 and reported an increase of 5.9%as compared with the previous financial year.
However, Free cash flow reported a decline of 13.1% on account of €49 million increase in net capital expenditure as the company had increased investments into revenue generating assets.
The Board has proposed a dividend of €0.57 per share in FY 2018, which was 5.6% higher than the proposed dividend in FY17.
Stock Performance – 1 Year

Daily price chart (as on April 10, 2019), before the market close. (Source: Thomson Reuters)
At the time of writing (as on April 10, 2019, at 12:02 PM GMT), shares of CCH were quoting at GBX 2,563.0 and added 7.0 points or 0.27% against its previous day close. During the past one-year, shares have registered a 52w high of GBX 2,817 and a 52w low of GBX 2,224.0 and at the current price level shares were trading 9.27 per cent below its 52w high level and 14.93 per centabove its 52w low price level.
From the simple moving average (SMA) standpoint, shares were trading below its 30-day and 60-day simple moving average price and marginally above its 200-day simple moving average price.
Its dividend yield of 1.87% was comparatively below the dividend yield of broader index FTSE 100. Shares of Coca-Cola HBC carrying a beta of 0.79 which indicates lower co-relation between the stock’s price movement and movement in the broader index.
On a yearly basis, the stock has delivered a price return of negative 5.3%.Stock’s performance over past one-year was largely below the FTSE 100 performance.
Valuation Methodology

Conclusion
The company has strong financials and scaling business model however, the company’s dividend yield of 1.87% was significantly below the broader index FTSE 100 dividend yield of 4.48%, and also at the profitability front, the company’s EBITDA margin, and Net Margin were considerably below the industry median of 23% and 12.1% respectively. Therefore, based on above indicators and valuation done by using the above method, we have given a “Watch” recommendation at the closing price of GBX 2,556 (as on April 09, 2019), based on 20.1x NTM Industry Average Price-to-Earnings Multiple (approx.) on FY19E EPS.
Associated British Food Plc
The UK based Associated British Foods plc (ABF) is one of the leading diversified food, ingredients and retail groups. The group’s major businesses include Sugar, Ingredients, Grocery, Agriculture and Retail. ABF caters its products primarily to industries including Agriculture, Pharmaceutical, Retail and Food. Capital Research Global Investors, Norges Bank Investment Management (NBIM), and The Vanguard Group, Inc.are the top institutional shareholders in the company. (Source: Thomson Reuters)
Recent Deals
On September 18, 2019, George Weton Foods Ltd (a subsidiary of Associated British Food Plc) has acquired 100 per cent stake in the Yumi’s Quality Food Pty Ltd form Anacacia Capital Pty Ltd, a Melbourne based manufacturer of prepared sauce.
Trading Updates (24weeks ending Mar-02-19)
On February 25, 2019, the company reported pre-close period trading update for the 24 weeks ended on March 02, 2019. Net Cash expected to be around £300 mn in the first half of FY19as compared with the net cash of £123 mn during the same period of the previous financial year. The group has also indicated that the revenue from sugar is expected to be lower in the first half of the current financial year as compared to the first half of the previous financial year, primarily on account of the lower sugar price in the European Union.
Financial Performance – FY18 (£mn)

Source: Company filings, LSE
Group's revenue surged by 1% on an actual basis to £15.6 bnand on a constant currency basis, revenue was up by 3%. During the FY18, group's 48% of total revenue came from Retail segment, 21.98% from Grocery, 12.51% from Sugar, 10.59% from Ingredients and 8.70% came from Agriculture segment respectively. On geographical contribution basis, UK remained the biggest contributor in the top-line of the company and accounted for 38.07% of the group's revenue, Europe & Africa accounted for 38%, Asia Pacific accounted for 14.11%, and The Americas accounted for 9.85% of the group's total revenue (Source: TR).
Group’s adjusted profit before tax stood at £1,404 mn and witnessed an increase of 5% against the previous financial year. Earnings per share for FY18 stood at 134.9 pence and increased by 6% as compared with the previous financial year.
For FY18, the board of the company proposed a dividend of 45.0 pence per share, which was 10% higher than the dividend paid in FY17.
Stock Performance – 1 Year

Daily price chart (as on April 10, 2019), before the market close. (Source: Thomson Reuters)
At the time of writing (as on April 10, 2019, at 02:11 PM GMT), shares of Associated British Food Plc were quoting at GBX 2,506.0 and added 28 points or 1.13% against its previous day close. In the past one-year, shares have registered a 52w high of GBX 2,846.0, and a 52w low of GBX 2,011.00and at the current price level, shares were trading 12.97% lower against its 52w high level and 23.17% higher against its 52w low price level. On a year-to-date basis, the stock has delivered a price return of 21.24% which was considerably above the FTSE 100 performance during the same period of time.
Also, shares were trading above its 30-day, 60-day and 200-day simple moving average price (SMA), which is a bullish indicator and price could go up further from the current levels. Stock’s 5-day average daily volume traded on the London Stock Exchange was 40.88% higher against the 30-day average daily volume traded on the London Stock Exchange.
Valuation Methodology

Conclusion
Associate British Food has strong fundamentals and business model, during FY18, the group has reported progress in its all five segments. The company has reported strong inventory turnover ratio of 5.6x, which was considerably above the industry median of 4.0xin FY18 and also the group was comparatively underleveraged as compared to its competitors, for FY18 debt/equity ratio stood at 0.08, whereas industry median was 0.34. Going forward, in April there was one potential positive catalyst for the share, Primark Birmingham flagship store opened on April 10 - this 160k square feet store will include the first Disney Cafe outside of Disney's resorts and cruise ships and Primark's biggest beauty studio to date. Therefore, based on the above rationale and valuation done by using above method, we have given a BUY recommendation at the closing price of GBX 2,477.0 (as on April 09, 2019), with single-digit upside potential, based on the 12.7x NTM Industry Median Price-to-Cash Flow multiple on FY19E Cash Flow Per Share.
*The buy recommendation is also valid for the current price as covered in the report (as on April-10-19).
Disclaimer
PLEASE BE ADVISED THAT YOUR CONTINUED USE OF THIS SITE OR THE INFORMATION PROVIDED HEREIN SHALL INDICATE YOUR CONSENT AND AGREEMENT TO THESE TERMS.
References to ‘Kalkine’, ‘we’, ‘our’ and ‘us’ refer to Kalkine Limited.
This website is a service of Kalkine Limited. Kalkine Limited is a private limited company, incorporated in England and Wales with registration number 07903332.
The website has been prepared for informational purposes only and is not intended to be used as a complete source of information on any particular company. Kalkine is not responsible for material posted on this website and does not guarantee the content, accuracy, or use of the content in this site. No advice or information, whether oral or written, obtained by you from Kalkine or through or from the service shall create any warranty not expressly stated.
Kalkine do not offer financial advice based upon your personal financial situation or goals, and we shall NOT be held liable for any investment or trading losses you may incur by using the opinions expressed in our publications, market updates, news alerts and corporate profiles. Kalkine does not in any way endorse or recommend individuals, products or services that may be discussed on this site. You should discuss your portfolios and the risk tolerance level appropriate for your personal financial situation, with a professional licensed financial planner and adviser. Our publications are NOT a solicitation or recommendation to buy, sell or hold.

 CA
 NZ
 US
 AU
 IND

 UK
 Please wait processing your request...