.png)
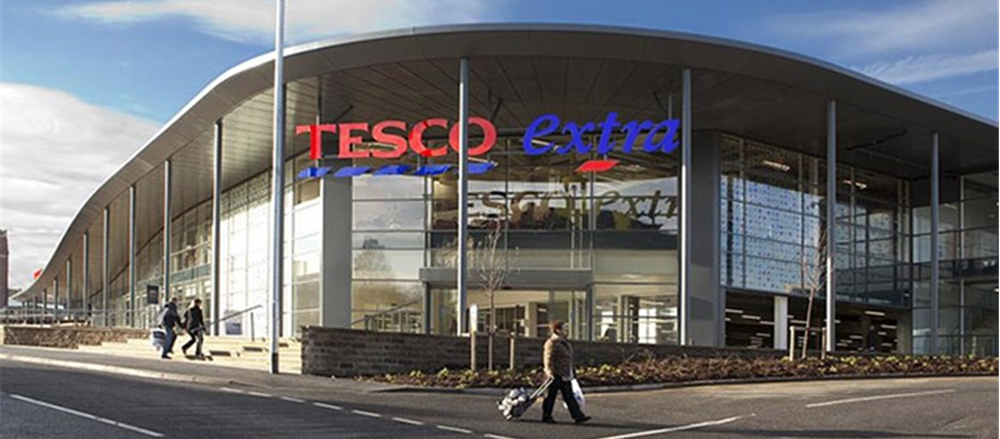
Tesco Plc
Tesco PLC (TSCO) is a United Kingdom-based retail company and is one of the largest retailers of consumer goods in the world, serving millions of customers every week through stores as well as online space. While the group also offers insurance and retail banking services, it mainly operates as a retailer of grocery products. The operations of the group are differentiated in two operating segments, namely Retail and Tesco Bank. The Retail division is further divided into three geographical segments: UK & ROI, Asia and Central Europe.
Recent Development
The company on 21st May 2019 announced that it had stopped new mortgage lending and was seeking to sell its existing mortgage portfolio, citing limited profitable growth opportunities due to challenging market conditions as the reason.
Trading Statement
In the first quarter of the financial year 2020, on a constant rate basis, the company’s total reported revenue rose by 0.4% to £13,978 million as compared to the corresponding period last year.Revenue increased by 1.3% to £11,168 million versus the previous year in the UK & ROI segment. In central Europe, revenue declined by 7.9% to £1,296 million, mainly because of store closures. In Asia segment, revenue grew by 2.6% to £1,244 million against the corresponding period last year, driven by the growth in the Bangkok area. In Tesco bank segment, sales declined by 1.9% to £270 million.
Key Financial Highlights (FY 2019, £m)
.png)
(Source: Company Filings)
As like-for-like sales in the UK and the Republic of Ireland (ROI) grew by 2.9%, group sales rose by 11.3% at constant exchange rates with like-for-like growth of 1.4% to £56.9bn, up from £51.0bn in FY 2018, while statutory revenue of £63.9bn grew by 11.2% year-on-year. Helped by cost savings programme and further simplification of operations, UK & ROI operating profit was up by 45.1% to £1,537m, leading to a group’s operating profit of £2,206m, up 34.0% at actual rates and up 33.5% at constant exchange rates. Statutory operating profit rose by 17.1% year-on-year to £2,153m, against £1,839m in FY18. Statutory profit before tax was reported at £1,674m, up by 28.8%, while profit/(loss) for the year was £1,320m.Reflecting the stronger profit performance, diluted earnings per share before exceptional items and other items were 15.40p, up by 29.4%, while statutory basic earnings per share from continuing operations were 13.65p, up by 12.3% year-on-year. Taking the total dividend for the year to 5.77p, up 92.3% year-on-year, the company announced to pay a final dividend of 4.10p per ordinary share.
Valuation Methodology
Method: Price/Cash Flow Approach (NTM)
.png)
Share Price Commentary
.png)
Daily Chart as at 13-August-19, before the market closed (Source: Thomson Reuters)
On 13 August 2019, at the time of writing (before the market closed, GMT 8:20 am), TSCO shares were trading at GBX 214.90, down by 0.71% against the previous day’s closing price. Stock's 52 weeks High and Low is GBX 264.10/GBX 187.05. The company's stock beta was 1.16, reflecting more volatility as compared to the benchmark index. Total outstanding market capitalisation was around GBP 21.16 billion, with a dividend yield of 2.66%.
Conclusion
In the first quarter, the group grew ahead of the UK market, reporting a strong start to the year as the group was helped by more competitive customer offer. The group also seeks to improve its operating margins to be in between 3.5% and 4.0% by 2019/20 by improving the mix across geographies, channels and product, and achieve the remaining goals in its turnaround plan in 2019/20. The group has continuously improved the quality and value of service and offers and is well-positioned to deliver strong, sustainable returns. The company is placing an increasing focus on growth in free cash flow and earnings and continues to strengthen its balance sheet. However, the company continues to face increasing risk from changing competitive landscape and price pressures across most of its markets.
Based on the above factors and supported by valuation done using the above method, we have given a “BUY” recommendation at the closing price of GBX 216.80 (as on 12 August 2019) with low double-digit upside potential, based on 7.10x NTM Price/Cash Flow multiple (approx.) on FY20E Cash Flow per share (approx.).
Valeura Energy Inc
Valeura Energy Inc (VLU) is a Canada-based upstream natural gas producer which focuses on exploring, developing and producing natural gas and condensate in Turkey, which is sold directly to the customers in the immediate vicinity. The company is also listed on the Toronto Stock Exchange. The group is focused on appraising and developing a deeper unconventional gas play and produces natural gas from conventional shallow accumulations in the Thrace Basin.
Key Financial Highlights (H1 FY 2019, CDN$ million)

(Source: Company Filings)
In the second quarter of 2019, net petroleum and natural gas sales averaged 700 boe/day, which was 9% lower when compared to Q1 2019 and declined by 5% over the prior year. Average realised gas price rise by 15% over the corresponding period last year to $8.54/Mcf but was down by 7% from Q1 2019. Due to a reduction in gas price realisations and lower production during the quarter, production revenue in Q2 2019 decreased by 16% to $3.3 million from Q1 2019 but reported an increase of 11% relative to Q2 2018. In the first half of the year, the group reported production revenue of $7.1 million, up from $6.4 million last year. Reflecting the end of drilling operations at the Devepinar-1 well in April 2019, exploration and development capital spending declined by 28% from Q1 2019 to $4.1 million in Q2 2019. Net loss from operations increased to $2.1 million in the second quarter from a loss of $1.4 million last year, while it was $5.2 million loss in the first half. Due to capital expenditures offset by cash flow from the business, the group reported a net working capital surplus of $52.3 million on 30 June 2019 as compared to $56.1 million at 31 March 2019.
Share Price Commentary

Daily Chart as at 13-August-19, before the market closed (Source: Thomson Reuters)
On 13 August 2019, at the time of writing (before the market closed, GMT 9:10 am), VLU shares were trading at GBX 170.00 and remained flat against the previous day’s closing price. Stock's 52 weeks High and Low is GBX 180.00/GBX 125.00. The company's stock beta was 0.91, reflecting slightly less volatility as compared to the benchmark index. Total outstanding market capitalisation was around GBP 149.52 million.
Conclusion
Though the recent political environment has not impacted the operations of the group directly, its functional currency Lira has devalued as a result of political events, which has impacted the revenues of the group and could affect the ability of the group to fund its capital programme in the future. The financials of the group are substantially dependent on prevailing prices of oil and gas, which are out of the control of the group and are subject to large fluctuations in response to relatively minor changes in the supply of and demand for oil and gas. The group has also not posted any profit yet and the group is currently trading at higher multiples – against industry median of 1.9x, its forward EV/Sales is at 19.3x.
Based on the headwinds faced by the group, we have given an "AVOID" recommendation at the closing price of GBX 170 (as on 12 August 2019).
*The buy recommendation is valid for the current price as covered in the report (as on 13-August-19).
*All forecasted figures and peers have been taken from Thomson Reuters.
Disclaimer
PLEASE BE ADVISED THAT YOUR CONTINUED USE OF THIS SITE OR THE INFORMATION PROVIDED HEREIN SHALL INDICATE YOUR CONSENT AND AGREEMENT TO THESE TERMS.
References to ‘Kalkine’, ‘we’, ‘our’ and ‘us’ refer to Kalkine Limited.
This website is a service of Kalkine Limited. Kalkine Limited is a private limited company, incorporated in England and Wales with registration number 07903332.
The article has been prepared for informational purposes only and is not intended to be used as a complete source of information on any particular company. Kalkine is not responsible for material posted on this website and does not guarantee the content, accuracy, or use of the content in this site. No advice or information, whether oral or written, obtained by you from Kalkine or through or from the service shall create any warranty not expressly stated.
Kalkine do not offer financial advice based upon your personal financial situation or goals, and we shall NOT be held liable for any investment or trading losses you may incur by using the opinions expressed in our publications, market updates, news alerts and corporate profiles. Kalkine does not in any way endorse or recommend individuals, products or services that may be discussed on this site. You should discuss your portfolios and the risk tolerance level appropriate for your personal financial situation, with a professional licensed financial planner and adviser.

 CA
 NZ
 US
 AU
 IND

 UK
 Please wait processing your request...