.png)
Ocado Group PLC
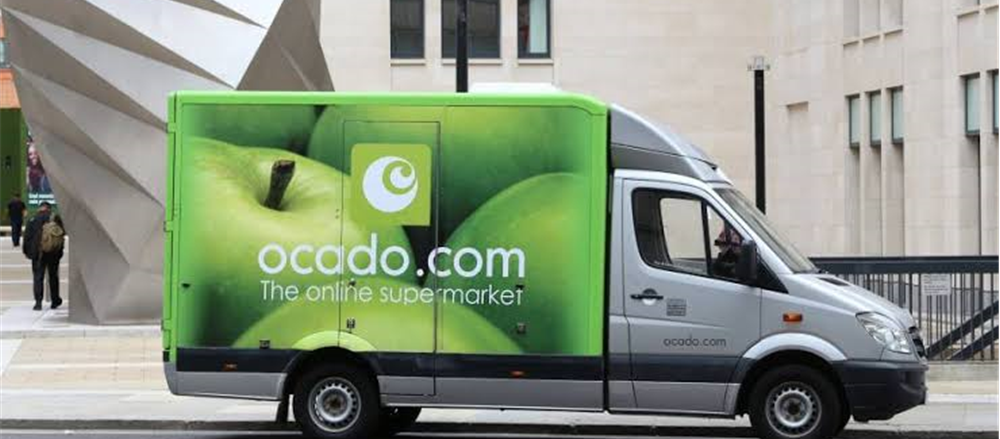
Ocado Group PLC (OCDO) is one of the largest online grocery retailers in the UK, which does not own any chain of stores as all home deliveries are done from its warehouses, as it has developed and operate a unique business model which positions it strongly as more consumers choose to shop online.Its business is based on proprietary technology and intellectual patent, which serves the unique end-to-end operating solution for online grocery retail operations and positions the group well to take advantage of these long-term structural trends, driven by different shopping habits and ever more advanced technology for the consumer.
Trading Update
.png)
(Source: Company Filings)
Led by successful results of joint venture between The Ocado Group Plc and Marks and Spencer Group Plc, which was completed on August 05, 2019, the group’s retail sales increased by 11.4% to £386.3m from £346.9m recorded in the year-ago period, driven by solid average orders per week growth of 12.1% recorded in the third quarter of FY19. Average orders per week during the quarter under consideration surged to 314,000 from 280,000 recorded in the year-ago period. However, average orders size was marginally reduced to £105.42 against £106.26 recorded in the same quarter of the corresponding financial year.
Financial Highlights (H1 2019, in £m)
.png)
(Source: Company Filings)
The company’s adjusted revenue increased by 10.5 per cent to £874 million as compared to £791.2 million in H1 FY18, driven by other fees earned from Morrisons, a surge in the average number of orders per week and in spite of capacity limitations following the fire at CFC Andover. Adjusted EBITDA stood at £18.7 million, a decrease of 46.3 per cent against the £34.8 million in H1 FY18, due to the surged investment in developing the head office teams required to support the international growth, higher share incentive costs in the period and annualised costs of the Erith CFC. Adjusted loss before tax was £43 million, an increase from the corresponding period of the last year. Cash and cash equivalents stood at £360.1 million, a decrease of £87.5 million against the previous year same period data. Average orders per week had solid underlying growth, with a slight decrease in the average order size. The company signed a 50/50 joint venture with M&S to transform its online grocery shopping in the United Kingdom.
Share Price Commentary
.png)
Daily Chart as at 07-November-19, before the market closed (Source: Thomson Reuters)
On 07 November 2019, at the time of writing (before the market closed, GMT 9:45 am), OCDO shares were trading at GBX 1,322.50, down by 0.4% against the previous day’s closing price. Stock's 52 weeks High and Low are GBX 1,440.50/GBX 733.74. The company's stock beta was 1.06, reflecting slightly more volatility as compared to the benchmark index. Total outstanding market capitalisation was around GBP 9.31 billion.
Conclusion
Although the company’s revenue rose in the H1 FY2019, the profitability margins have remained stagnant or declined. The company might fail to develop a retail proposal which might fail to appeal to the customers and will further impact the growth of the company. The company might fail to execute Ocado Solutions deals effectively and efficiently, which will further increase the costs and reduce the profits for projects. Due to ongoing uncertainty over Brexit, the company will be affected by supply chains disruption, expansion in costs related to import and struggle in hiring required employees. Moreover, the stock was quoting at a steep higher valuation against the peer group companies and its long-term debt is substantially higher within the selected peer group.
Based on the above rationale, we have given a "Watch" recommendation at the closing price of GBX 1,330.5 (as on 06 November 2019), while we look for any upcoming catalysts.
JD Sports Fashion PLC
JD Sports Fashion PLC (JD) is a multichannel retailer of branded sports and casual wear, which combines the best of physical and digital retail to give a compelling consumer proposition and helping to establish an industry-leading retail business. Ongoing investment in its international multichannel capability complements the continuing international growth in physical store space, and it uses own brands to present them as complementary to third party brands. It has over 700 stores in 19 territories across the globe, with strong own brand labels such as Pink Soda and Supply & Demand, along with globally recognised brands such as Nike, Adidas, Puma and The North Face. The operations of the group are differentiated in two operating segments, namely Sports Fashion and Outdoor.
Recent Developments
In the exchange filing made by the company as on October 01, 2019, it reported that, following the CMA's Phase 1 decision, the group has prudently considered the CMA's analysis and their claim that the takeover of Footasylum would give rise to a substantial lessening of competition.
Financial Highlights (H1 2019, in £m)
.png)
(Source: Company Filings)
During the first half under consideration, the group’s revenue surged 47% to £2,721.2m against £1,846.3m reported in the H1FY18, driven by 12% Like-for-like sales growth in its global Sports Fashion fascias. Reflecting the inclusion of the lower margin Finish Line business for the whole period, total gross margin in the period of 46.9% was 1.3% lower than the previous year (H1 2018: 48.2%). The proforma headline profit before tax and exceptional items to 3 August 2019 under IAS 17 ‘Leases’ would have been £166.2 million and profit before tax and exceptional items for the year increased by 30.1% to £158.6 million (H1 2018: £121.9 million), while group profit before tax increased by 6.6% to £129.9 million (H1 2018: £121.9 million). The adjusted earnings per ordinary share increased by 25.1% to 12.57p (H1 2018: 10.05p) and reflecting the higher participation of profits from the United States, the basic earnings per ordinary share decreased slightly to 9.67p (H1 2018: 10.05p).
Share Price Commentary
.png)
Daily Chart as at 07-November-19, before the market closed (Source: Thomson Reuters)
On 07 November 2019, at the time of writing (before the market closed, GMT 9:43 am), JD shares were trading at GBX 754.40, up by 1.7% against the previous day’s closing price. Stock's 52 weeks High and Low are GBX 795.40 /GBX 318.50. The company's stock beta was 0.81, reflecting less volatility as compared to the benchmark index. Total outstanding market capitalisation was around GBP 7.24 billion, with a dividend yield of 0.23%.
Conclusion
The majority of both third party-branded product and the own branded product of the group is sourced outside of the UK, as it operates with a highly integrated stock management infrastructure for its stores across Europe and the increased risk of a disorderly exit could have potentially adverse consequences on supply chains, tariffs and consumer demand. Additionally, as the threat of potential downturn increases, discretionary spending on the products of the group can decline, which can impact future operations and financials. Moreover, as consumer preferences change over time, there could be a further shift of revenue from bricks and mortar stores to e-commerce, which although can decrease costs but also become a threat for the group if it is not in a place to adapt. After the critical Christmas trading period, the company will provide an update on trading in early January, which would give better clarity about the impact of Brexit and macro economy on demand for products.
Based on the above rationale, we have given a "Watch" recommendation at the current price of GBX 754.40 (as on 07 November 2019), while we look for any upcoming catalysts.
Disclaimer
PLEASE BE ADVISED THAT YOUR CONTINUED USE OF THIS SITE OR THE INFORMATION PROVIDED HEREIN SHALL INDICATE YOUR CONSENT AND AGREEMENT TO THESE TERMS.
References to ‘Kalkine’, ‘we’, ‘our’ and ‘us’ refer to Kalkine Limited.
This website is a service of Kalkine Limited. Kalkine Limited is a private limited company, incorporated in England and Wales with registration number 07903332.
The article has been prepared for informational purposes only and is not intended to be used as a complete source of information on any particular company. Kalkine is not responsible for material posted on this website and does not guarantee the content, accuracy, or use of the content in this site. No advice or information, whether oral or written, obtained by you from Kalkine or through or from the service shall create any warranty not expressly stated.
Kalkine do not offer financial advice based upon your personal financial situation or goals, and we shall NOT be held liable for any investment or trading losses you may incur by using the opinions expressed in our publications, market updates, news alerts and corporate profiles. Kalkine does not in any way endorse or recommend individuals, products or services that may be discussed on this site. You should discuss your portfolios and the risk tolerance level appropriate for your personal financial situation, with a professional licensed financial planner and adviser.

 CA
 NZ
 US
 AU
 IND

 UK
 Please wait processing your request...