Sage Group (SGE)
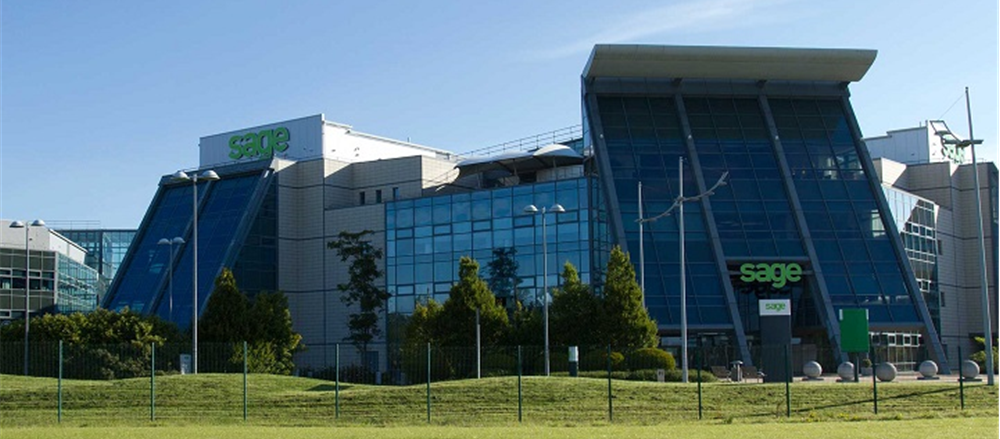
The Sage Group Plc is a UK based provider of integrated accounting, payroll and payments solutions, and is headquartered in Newcastle upon Tyne, United Kingdom. Its accounting solutions are Sage One, Sage Live and Sage X3; its payments solutions are Sage Pay and Sage Payments; and its payroll solutions are Sage One Payroll, Sage 50 Payroll and Sage X3 People. The company was incorporated in 1981 and employs around 13k personnel. The outstanding market capitalisation of the company stood at £7.44 bn and dividend yield stood at 2.42%.
Recent Developments
On February 22, 2019, Company announced that disposal of Sage Payroll Solutions, the US based payroll outsourcing business has been completed on February 21. 2019. On December 4, 2019, company announced the appointment of Jonathan Howell as a Chief Financial Officer.
Financial Performance – FY18 (£ Mn)

(Source: Company filings)
Organic revenue rose by 6.8% during FY18 to £1,819 million as compared with revenue of £1,703 million in FY17. Growth in organic revenue over the year was supported by 7% growth in organic revenue during H2 FY18, which was driven by focus on high-quality recurring and subscription revenue, led by stellar growth in recurring revenue in excess of 7% in both August and September. North Europe witnessed recovery in recurring revenue, with reported growth in every month of the second half of FY18, and in France, last quarter of FY 2018 delivered strongest quarter since Q1 FY16, company attained a double-digit growth in North America. During the year organic operating margin stood at 27.8% and ROCE stood at 23%. Free cash flow rose significantly to £356 million, accounting for 19% of revenue. Statutory operating profit in FY18 stood at £427m, up by 22.7% against the last year data. In FY18, the Ordinary dividend per share was 16.5p against 15.42p reported last year, a surge of 7%.
Stock Performance – 1 Year

Daily Chart as at Mar-19-19, after market closed (Source: Thomson Reuters)
At the time of writing (as on March 19, 2019, at 10:30AM GMT), shares of Sage Group were quoting at GBX 684.20 added 3.2 points or 0.47% against its previous day closing price. During the last one-year, shares have reached a 52w high of GBX 699.60 and a 52w low of GBX 491.30. On a year-to-date basis stock was up by 13.24% with a dividend yield of 2.42%.
Conclusion
Although the company’s revenue and bottom-line numbers rose in FY 2018, the profitability margins have remained stagnant or declined. Moreover, the company is trading near its 52-week high, raising doubts at its upside potential at current prices. The company operates in a dynamic industry which requires continuous investment, sometimes at the cost of profitability, to stay ahead of competitors. Keeping in mind the weak relative valuation of the company and stock near its 52w levels, we recommend the stock is quite expensive at the current levels and investors should avoid taking fresh positions at the current price.
Aveva Group Plc (AVV)
The software and computer service provider AVEVA Group Plc was incorporated in 1967 and is headquartered in Cambridge, United Kingdom. Company is engaged in providing engineering, design and information management software with geographical presence in Asia Pacific, Americas and Europe and EMEA. The outstanding market capitalisation of the company stood at £5.02 bn and dividend yield stood at 1.32%.
Recent Developments
On February 05, 2019, J.P Morgan Cazenove was appointed as a joint corporate broker. Shares of AVEVA rose by 6.39% post the announcement made. On November 20, 2018 company reported its half-year results for the period ended September 30, 2018. Statutory Revenue surged by 56.4% to £336.5 million on reverse acquisition basis.
Financial Performance – H1 FY19 (£ Mn)

(Source: Company filings)
During H1 FY19 statutory revenue surged by 56.4% to £336.5 million as compared with revenue of £215.1 million in H1 FY18, primarily due to reporting of SES business only in the corresponding period. Loss before tax stood at £5.5 million during H1 FY19 as compared to the profit of £7.8 million in H1 FY18. During the period, statutory adjusted profit-before-tax improved by 89.2% to £54.1m; adjusted diluted EPS was 26.25p and diluted loss earnings per share of 3.61p.
Stock Performance – 1 Year

Daily Chart as at Mar-19-19, after market closed (Source: Thomson Reuters)
At the time of writing (as on March 19, 2019, at 11:13AM GMT) shares of AVEVA Group Plc were trading at GBX 3,164, rose by 54 points or 1.73% against the previous closing price. Company’s outstanding market capitalisation stood at £5.02 billion. Dividend yield of AVEVA stood at 1.32%. During the last one-year stock has reached a 52w high of GBX 3,156.67 and a 52w low of GBX 1,837 respectively.
Conclusion
Shares of AVEVEA Plc is trading at LTM Price-to-Earnings ratio of 111.94x which makes it considerably expensive at this price and also at LTM EV/EBIT multiple of 82.56x, stock looks very expensive. We will recommend avoiding this stock at this price level.
Note- GBp or GBX are interchangeably used for Pence Sterling.
Disclaimer
PLEASE BE ADVISED THAT YOUR CONTINUED USE OF THIS SITE OR THE INFORMATION PROVIDED HEREIN SHALL INDICATE YOUR CONSENT AND AGREEMENT TO THESE TERMS.
References to ‘Kalkine’, ‘we’, ‘our’ and ‘us’ refer to Kalkine Limited.
This website is a service of Kalkine Limited. Kalkine Limited is a private limited company, incorporated in England and Wales with registration number 07903332.
The website has been prepared for informational purposes only and is not intended to be used as a complete source of information on any particular company. Kalkine is not responsible for material posted on this website and does not guarantee the content, accuracy, or use of the content in this site. No advice or information, whether oral or written, obtained by you from Kalkine or through or from the service shall create any warranty not expressly stated.
Kalkine do not offer financial advice based upon your personal financial situation or goals, and we shall NOT be held liable for any investment or trading losses you may incur by using the opinions expressed in our publications, market updates, news alerts and corporate profiles. Kalkine does not in any way endorse or recommend individuals, products or services that may be discussed on this site. You should discuss your portfolios and the risk tolerance level appropriate for your personal financial situation, with a professional licensed financial planner and adviser. Our publications are NOT a solicitation or recommendation to buy, sell or hold.

 CA
 NZ
 US
 AU
 IND

 UK
 Please wait processing your request...