
Superdry PLC
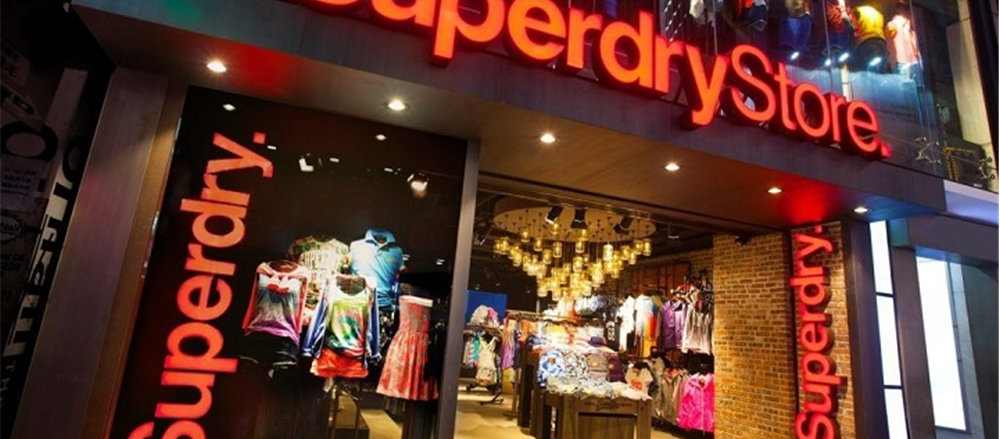
Superdry (SDRY) is an apparel brand with the main focus on providing good quality products. The company’s products use British style with a mix of Americana and Japanese inspired graphics. The company’s products are known for its quality fabrics, exclusive detailing, authentic vintage washes, hand-drawn graphics and custom fits for unique styling. The company had its operations in 46 countries and is operating 515 Superdry stores. The company owns 139 stores within the UK and 168 stores outside the UK. The company also has franchised and licensed 208 stores and sell to more than 100 countries globally via Superdry.com.
Trading Update – FY2019
The group’s revenue from Global Brand surged by 3.6 per cent to £1,736.1 millionfor FY2019 against FY2018 data, mainly due to strong Wholesale performance and decent growth in E-commerce business. The group’s revenue was almost flat for FY2019 at £871.7 million from £872 million for FY 2018, due to lower sales booked at store sales. Wholesale revenue for FY2019 was £335 million and increased by 3.6 per cent. E-commerce revenue was up by 1.6 per cent to £163.7 millionas compared with the financial year 2018 of £161.2 million. Store revenue declined by 3.7 per cent to £373 millionagainst the £387.4 million in 2018.
Financial Highlights (H1 FY2019, £million)

(Source: Interim Report, Company Website)
The company’s revenue from Global Brand surged by 6.4 per cent to £831.8 millionfor H1 FY2019 against £781.6 million for H1 FY2018. The group’s revenue was up by 3.1 per cent for H1 FY2019 to £414.6 million from £402 million for H1 FY 2018, due to strong wholesale performance. Gross profit stood at £233.7 million against £229.5 million in H1 FY2018. The company’s underlying operating profit was £14.9 million for H1 FY2019 against £27 million for H1 FY2018. The company’s underlying Profit before tax dipped by 49 per cent to £12.9 million in H1 FY2019 from £25.3 million in H1 FY2018. Profit for the period for H1 FY2019 was £20.2 million against £7.9 million for H1 FY2018. The company’s Underlying basic earnings per share was 11.9 pence for H1 FY2019 as compared to 25.8 pence in H1 FY2018. The company’s Interim dividend held at 9.3 pence for H1 FY2019.
Share Price Performance

Daily Chart as at May-24-19, before the market closed (Source: Thomson Reuters)
On 24th May 2019, at the time of writing (before the market close, GMT 8:47 AM), SDRY shares were trading at GBX 492.25, up by 1.04 per cent against the previous day closing price. Stock's 52 weeks High and Low is GBX 1,370.96/GBX 354. The company’s stock beta was 1.42, reflecting higher volatility as compared to the benchmark index.
Conclusion
Management has taken initial action to stabilise the business and a full review is due with the consolidated full-year results in July. The group has indicated it will continue with the £50 million gross cost saving programme by FY22 and to expect non-cash onerous lease/store impairment charges with the FY results. The number of options to be sold online has risen and stock density in flagship stores has increased. Action has also been taken to reduce promotional activity. Management guidance for FY19 – PBT will be below the consensus range of £54.1 million to £59.4 million, with no further clear guidance on margin and costs.There was an increase in the financial performance for the H1 for the financial year 2019, but in Q4 FY2019, the financial performance was hampered due to a decline in sales from company’s wholesale and e-commerce business. The uncertainty over the Brexit will impact the group’s business performance. The company’s operations will be impacted by the surge in the import duties particularly in Turkey and any delayed shipment will impact the availability in the distribution centre. As the company operates worldwide, their financial performance can be dented with the fluctuations in the exchange rate and can also lead the company towards legal and regulatory risks. Based on the risks associated with the operations of the company and the stock trading near the 52w low, we recommend investors to keep a cautious “Watch” on the stock at the current price of GBX 492.25 (as on 24th May 2019, before the market close), and support from future growth catalysts needs to be evaluated at a subsequent stage.
Moneysupermarket.Com Group PLC
Moneysupermarket.Com Group PLC (MONY) is a British company which, through its brands, operates finance and travel price comparison websites and helping households to save money. The company operates a data-driven marketplace with the help of its brands: MoneySuperMarket, MoneySavingExpert, and TravelSupermarket. The company aims at markets ranging from insurance, money and home services products to finance and travel.
Trading Update (Q1 FY2019)
Revenues grew by 19 per cent to £104.9 millionas compared to £88.3 million in Q1 FY18, driven by the acquired Decision Technologies and an exceptionally strong energy switching performance aided by price rises and collectives. Home Services surged by 70 per cent to £19.6 million against the £11.5 million in Q1 FY18. Other revenue climbed by 80 per cent to £11.7 millionas compared with the last year same period data. Insurance and Money revenue rose by 3 per cent and 9 per cent to £48.3 million and £25.3 million. On 14th February 2019, the board proposed £40 million enhanced distribution & associated shareholder consultation. The company’s board also gave a special dividend per share of 7.46 pence.
Financial Highlights (FY2018, £million)

(Source: Annual Report, Company Website)
In 2018, the company's revenue rose to £355.6 million, reporting an increase of 7.9%. The rise in revenue was driven by strong performance across the segments: Insurance grew by 4% amid a challenging market, Home Services, driven by energy switching, increased by 15%. The growing trend towards mobile has put pressure on the gross margins, which fell to 71% in 2018 from 74% in 2017. Operating profit rose by 14% to £108 million in FY 2018. Adjusted EBITDA growth surged by 2% to £129.4 million. Basic statutory EPS for the year was 16.2p, while adjusted EPS grew by 3% to 17.4p. The group proposed a final dividend per share of 8.10 pence, taking the proposed full-year dividend per share to 11.05 pence.
Share Price Performance

Daily Chart as at May-24-19, before the market closed (Source: Thomson Reuters)
On 24th May 2019, at the time of writing (before the market close, GMT 8:40 AM), MONY shares were trading at GBX 366.90, down by 0.05 per cent against the previous day closing price. Stock's 52 weeks High and Low is GBX 376.83/GBX 252.72. The company’s stock beta was 0.66, reflecting lower volatility as compared to the benchmark index.
Conclusion
The company reported decent Q1 FY19 top-line performance, but outlook remains unchanged with the group expecting moderation in Home Services through FY19.The company's business model offers an excellent long-term prospect as the price-comparison websites are expected to increase their penetration across several industries. This will help the company to grow revenues across existing product lines, or venture into new segments. The group's focus on optimising its sites and making it more personalised will make the interface for users even more accessible and which will further help to gain traction. However, the company relies on the attractiveness of deals offered by product providers, which might come under pressure in an uncertain macro environment and low-interest rates. The company operates in a competitive environment which continuously demands new technology and increased marketing costs. Additionally, there is a continuous risk of regulatory intervention which might affect the operating model of the company. Moreover, in 2019, the company plans to offer more personalised ways for the users which will further help to gain traction. Based on decent fundamental performance and stock currently trading near the 52-weeks High, we have given a “HOLD” recommendation at the closing price of GBX 367.10 (as on 23rd May 2019).
Disclaimer
PLEASE BE ADVISED THAT YOUR CONTINUED USE OF THIS SITE OR THE INFORMATION PROVIDED HEREIN SHALL INDICATE YOUR CONSENT AND AGREEMENT TO THESE TERMS.
References to ‘Kalkine’, ‘we’, ‘our’ and ‘us’ refer to Kalkine Limited.
This website is a service of Kalkine Limited. Kalkine Limited is a private limited company, incorporated in England and Wales with registration number 07903332.
The article has been prepared for informational purposes only and is not intended to be used as a complete source of information on any particular company. Kalkine is not responsible for material posted on this website and does not guarantee the content, accuracy, or use of the content in this site. No advice or information, whether oral or written, obtained by you from Kalkine or through or from the service shall create any warranty not expressly stated.
Kalkine do not offer financial advice based upon your personal financial situation or goals, and we shall NOT be held liable for any investment or trading losses you may incur by using the opinions expressed in our publications, market updates, news alerts and corporate profiles. Kalkine does not in any way endorse or recommend individuals, products or services that may be discussed on this site. You should discuss your portfolios and the risk tolerance level appropriate for your personal financial situation, with a professional licensed financial planner and adviser.

 CA
 NZ
 US
 AU
 IND

 UK
 Please wait processing your request...