Figma Inc (NYSE: FIG)
Figma, Inc. (NYSE: FIG) designs and develops platforms for people who build digital products together. The Company helps cross-functional teams align and build software more efficiently and ensure the advanced access and controls that large organizations require. Its products include Figma Design, Dev Mode, Figma Sites, Figma Make, Figma Draw, Figma Buzz, FigJam and Figma Slides.

Key Business and Financial Updates:
- Revenue Growth Acceleration and Record Fiscal Year 2025 Performance: Figma, Inc. delivered a robust conclusion to fiscal year 2025, with fourth-quarter revenue increasing 40% year-over-year, representing an acceleration relative to preceding quarters. Full-year revenue reached USD 1.056 billion, reflecting 41% year-over-year growth and exceeding the upper end of management guidance. The company also generated USD 130 million of non-GAAP operating income during the year, equating to a 12% operating margin, while maintaining a strong 88% gross margin for the full year. The results underscore sustained demand across customer segments and continued success in monetizing platform expansion.
- Customer Expansion, Retention and Enterprise Penetration: Customer metrics strengthened materially during the period, reflecting healthy engagement and deepening enterprise adoption. Net dollar retention for customers generating more than USD 10,000 in annual recurring revenue (ARR) increased to 136%, the highest level recorded in ten quarters, while gross retention remained stable at 97%, demonstrating durable customer relationships. During the quarter, Figma added 951 net customers above the USD 10,000 ARR threshold and 143 net customers above the USD 100,000 ARR threshold, with the latter cohort expanding 46% year-over-year. Enterprise momentum was particularly notable, with 67 customers now generating more than USD 1 million in ARR, representing growth of 68% year-over-year.
- Artificial Intelligence Adoption, Product Innovation and Platform Integration: Artificial intelligence emerged as a central growth catalyst during 2025. Approximately 75% of paid customers with more than USD 10,000 in ARR now consume AI credits on a weekly basis, compared with none in the prior year. During the year, Figma expanded its product suite from four to eight products and introduced more than 200 new features, highlighting substantial product velocity. Figma Make weekly active users increased by more than 70% quarter-over-quarter, with nearly 60% of files created by non-designers, illustrating growing cross-functional adoption. In addition, over 80% of full-seat Make users also utilize Figma Design, supporting the company’s strategy of building an integrated design-to-production ecosystem.
- International Growth and Monetization Evolution: International markets continued to contribute strongly, with revenue increasing 45% year-over-year. While international users represented approximately 85% of monthly active users, they accounted for only 54% of revenue, indicating a meaningful monetization opportunity over time. Pricing and packaging changes provided a mid-single-digit uplift to 2025 revenue, with renewal-related benefits expected to continue into early 2026. Beginning in March 2026, Figma plans to transition toward a hybrid monetization framework combining traditional seat-based subscriptions with AI credit consumption, thereby introducing an additional revenue lever not reflected in historical financial performance.
- 2026 Outlook, Investment Cycle and Financial Flexibility: For fiscal year 2026, management has guided revenue to a range of USD 1.366 billion to USD 1.374 billion, implying approximately 30% growth at the midpoint. Non-GAAP operating income is expected to be between USD 100 million and USD 110 million, suggesting margin moderation to approximately 8% as the company increases investment in AI infrastructure, product development, and talent acquisition. Adjusted free cash flow is expected to remain broadly aligned with operating income despite elevated infrastructure spending and prior acquisition-related tax impacts. With USD 1.7 billion in cash and equivalents at year-end, Figma retains substantial financial flexibility to support strategic growth initiatives, AI-native workflow development, and further enterprise expansion.
Key Company specific risks for FIG:
- Monetization and AI Consumption Model Risk: Figma, Inc. is shifting toward a hybrid revenue model that combines seat subscriptions with AI credit consumption. While adoption trends are encouraging, usage-based monetization can introduce revenue variability. Changes in customer AI usage patterns or cost sensitivity may affect growth visibility, particularly given the infrastructure intensity associated with AI features.
- Competitive and Platform Substitution Risk: The collaborative design and AI-assisted prototyping market is increasingly competitive, with both established software providers and AI-native platforms expanding capabilities. If competing ecosystems achieve functional parity or embed similar workflows into broader platforms, differentiation and pricing power could moderate over time.
- Margin Compression and Investment Risk: The company has indicated near-term margin compression due to elevated investment in AI infrastructure and product development. If operating expenses or infrastructure costs scale faster than revenue realization, profitability metrics may remain under pressure during the investment cycle.
Technical Observation (on the daily chart):
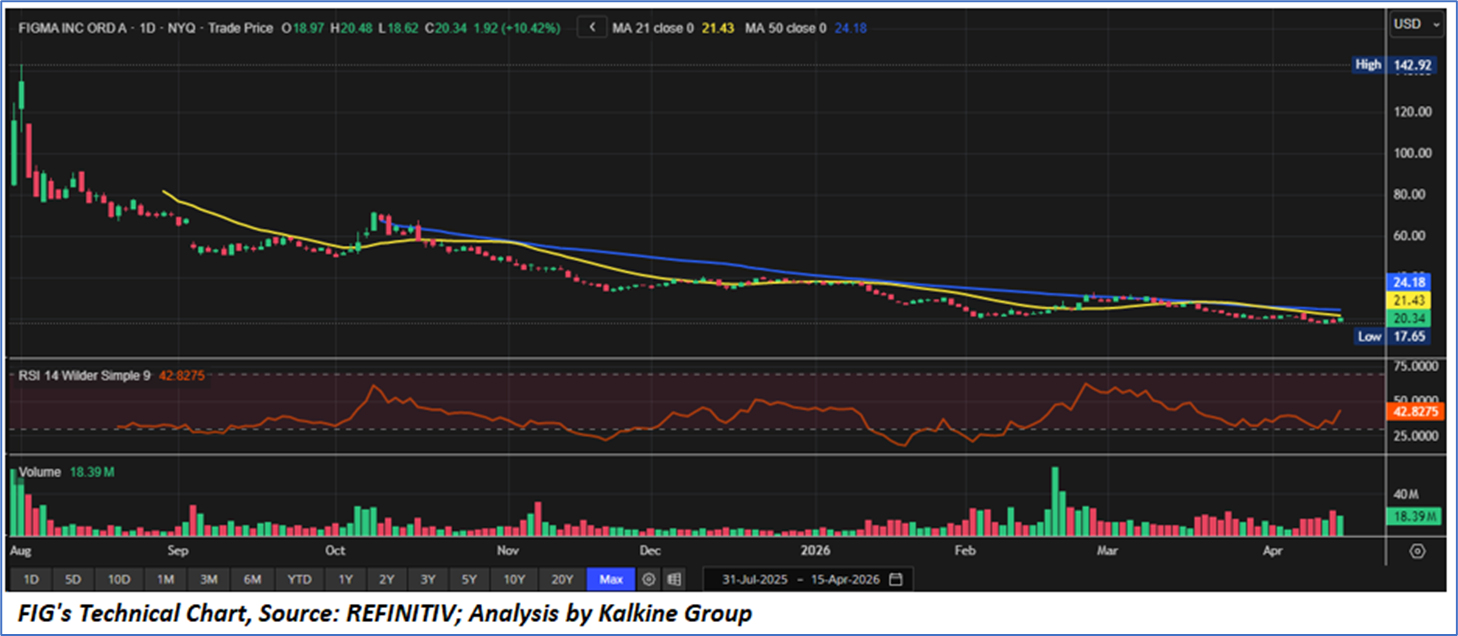
- Persistent Long-Term Downtrend with Early Signs of Stabilization: Figma Inc. (NYSE: FIG) continues to trade within a pronounced long-term corrective trend, with the share price currently at approximately USD 20.34, substantially below its historical high of USD 142.92. Over the observed period, the stock has exhibited a sustained sequence of lower highs and lower lows, reflecting continued valuation compression and cautious investor sentiment. However, recent price action suggests the pace of decline may be moderating, with shares stabilizing above the recent low near USD 17.65. This behavior may indicate the early formation of a technical base, provided downside support remains intact.
- Moving Average Structure and Momentum Conditions: The stock is presently trading below both the 21-day moving average of USD 21.43 and the 50-day moving average of USD 24.18, indicating that near- and medium-term trend momentum remains weak. Nonetheless, the narrowing gap between current price and the short-term moving average suggests improving relative strength compared with earlier phases of the decline. The 14-day Relative Strength Index stands near 83, reflecting neutral-to-soft momentum conditions. While RSI remains below the bullish 50 threshold, it has recovered from lower levels and does not currently indicate oversold conditions, leaving scope for either rebound continuation or renewed weakness depending on price confirmation.
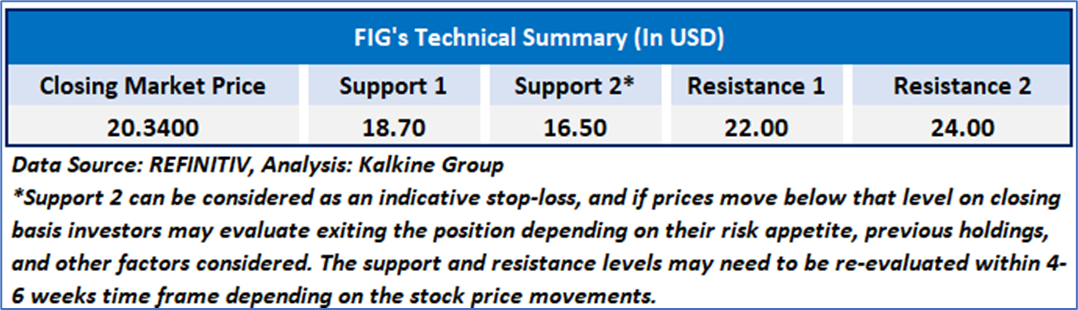
- Support, Resistance and Tactical Outlook: Immediate technical support is visible in the USD 19.50–20.00 range, followed by stronger structural support near the recent trough at USD 17.65. Holding above these levels would be important for sustaining the emerging stabilization narrative. On the upside, initial resistance is located near the 21-day moving average at USD 21.43, followed by more significant resistance near the 50-day moving average at USD 24.18. A sustained move above these levels could improve sentiment and signal a broader recovery phase, whereas rejection below resistance may prolong the existing consolidation. Overall, FIG remains technically cautious, though recent price action suggests a potentially improving risk-reward setup if support levels continue to hold.
Figma Inc. (NYSE: FIG) continues to demonstrate a fundamentally attractive software platform profile, supported by strong fiscal 2025 execution with revenue of USD 1.056 billion growing 41% year-over-year, robust gross margins of 88%, expanding enterprise adoption, and rising monetization across a broadened product ecosystem . The company’s accelerating AI integration, strong customer retention metrics, increasing international contribution, and substantial cash balance of USD 1.7 billion provide meaningful strategic flexibility as management invests for the next phase of growth. Looking ahead, fiscal 2026 revenue guidance implies continued expansion of approximately 30%, although near-term margins are expected to moderate due to elevated AI infrastructure and product investment. From a market perspective, the shares remain in a longer-term corrective trend but recent technical stabilization near support levels may indicate improving sentiment as investors reassess the balance between growth durability, monetization potential, and near-term investment intensity.
As per the above-mentioned price action, important resistance near USD 22.00- USD 24.00, momentum in the stock over the last month, and technical indicators analysis, a ‘WATCH’ rating has been given for Figma, Inc. (NYSE: FIG), at the closing price of USD20.34, as of April 15, 2026.
Individuals can evaluate the stock based on the support and resistance levels provided in the report in case of keen interest taking into consideration the risk-reward scenario.
Markets are trading in a highly volatile zone currently due to certain macro-economic issues and prevailing geopolitical tensions. Therefore, it is prudent to follow a cautious approach while investing.
Related Risk: This report may be looked at from a high-risk perspective, and a recommendation is provided for a short duration. This report is solely based on technical parameters, and the fundamental performance of the stocks has not been considered in the decision-making process. Other factors which could impact the stock prices include market risks, regulatory risks, interest rates risks, currency risks, social and political instability risks etc.
Note 1: Past performance is not a reliable indicator of future performance.
Note 2: The reference date for all price data, currency, technical indicators, support, and resistance level is April 15, 2026. The reference data in this report has been partly sourced from REFINITIV.
Note 3: Investment decisions should be made depending on an individual's appetite for upside potential, risks, holding duration, and any previous holdings. An 'Exit' from the stock can be considered if the Target Price mentioned as per the Valuation and or the technical levels provided has been achieved and is subject to the factors discussed above.
Note 4: Target Price refers to a price level that the stock is expected to reach as per the relative valuation method and or technical analysis taking into consideration both short-term and long-term scenarios.
Note 5: ‘Kalkine reports are prepared based on the stock prices captured either from the New York Stock Exchange (NYSE), NASDAQ Capital Markets (NASDAQ), and or REFINITIV. Typically, all sources (NYSE, NASDAQ, or REFINITIV) may reflect stock prices with a delay which could be a lag of 15-20 minutes. There can be no assurance that future results or events will be consistent with the information provided in the report. The information is subject to change without any prior notice.

 CA
 NZ
 US
 AU
 IND

 UK

 Please wait processing your request...