.png)
Glencore Plc
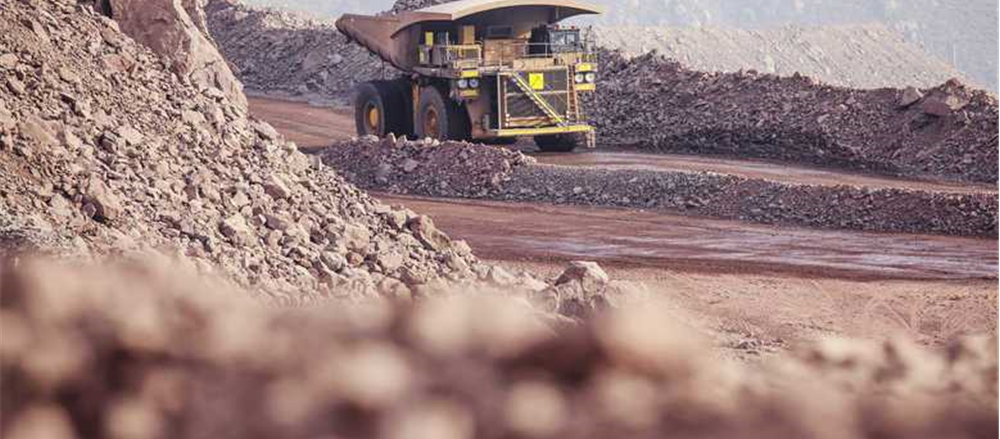
Glencore Plc (LON: GLEN) is among the world’s prominent diversified natural resource companies, which is involved in the business of production and distribution of minerals and metals, crude oil and oil products, coal and agricultural products. The company currently operates in more than 50 countries and has an employee base of 158,000, including contractors. The company is currently managing over 150 mines across the globe.
Recent News
On 5th December 2019, Glencore announced the opening of SFO (Serious Fraud Office) to investigate into the suspicions of bribery in business conduct by the company.
Third Quarter 2019 Production Report (as on 25th October 2019)
In the third quarter of 2019, the group’s copper production was recorded at 1,015,800 tonnes, a decrease of 4 per cent against the corresponding period of the last year. The company’s cobalt production surged by 21 per cent to 34,400 tonnes in Q3 FY19 against the same period in 2018. The company’s zinc production for the third quarter of 2019 was recorded at 809,200 tonnes, which was 3 per cent higher than the third quarter of 2018. In Q3 FY19, the company’s nickel production stood at 89,400 tonnes, a decrease of 2 per cent from the Q3 FY18. The company’s coal production was 104 million tonnes in the third quarter of 2019, which was 8 per cent higher than the third quarter of 2018.
Financial Highlights (for the six months ended 30 June 2019)
In the first half of the financial year 2019,the company’s revenue was reported at $107,098 million against the $108,554 million for the same period in 2018. The company’s Adjusted EBITDA for H1 FY2019 was reported at $5,582 million against the $8,180 million in H1 FY2018. The company’s basic and diluted earnings per share were US$ 0.02 in H1 FY19 against the US$ 0.19 in H1 FY2018.
Share Price Performance
.png)
Daily Chart as at 20th December 2019, before the market close (Source: Thomson Reuters)
On 20th December 2019, Glencore Plc shares were trading at GBX 240.30 at the time of writing before the market close (at 9:25 AM GMT), up by 0.27 per cent against the previous day closing price. Stock's 52 weeks High and Low are GBX 343.90/GBX 212.10.The company’s stock has given investors 6.38 per cent of a positive return in the last week.
Valuation Methodology
.png)
Conclusion
In the third quarter of 2019 production report, the company’s performance showed a tough economic backdrop for the commodity mix and also for the cost and operating setbacks within the development assets. The remainder of the business, however, stayed robust and well-positioned. Excluding the Koniambo and the African copper assets, the coal and metal industrial assets provided strong Adjusted EBITDA mining margin of 39 per cent. Adjusted EBIT guidance will be in the range of $2.2-$3.2 billion. Going ahead, the company is assured that the commodity market fundamentals will step in the company’s favour and that the varied commodity portfolio will perform a vital role in the transition to a low-carbon economy with the international progress. All through continued constructive collaboration, the company stay concentrated on generating sustainable long-term value for all shareholders.
Over the course of 3 years (FY15 - FY18), the company’s revenue surged from USD 147,351 million in FY15 to USD 219,754 million in FY18. Compounded annual growth rate (CAGR) stood at 14.25 per cent.
Based on the decent growth prospects and supported by the valuation as done above, we have given a “BUY” recommendation at the current price of GBX 238.35 (as on 20th December 2019, before the market close at 8:20 AM GMT) with single-digit upside potential, based on 20.70x NTM Price/Earnings (approx.) on FY19E earnings per share (approx.).
Rolls-Royce Holdings PLC
Rolls-Royce Holdings Plc (LON: RR) is a London, United Kingdom-headquartered multinational engineering company with a focus on power and propulsion systems. It is one of the world’s leading industrial technology companies and seeks to deliver clean, safe and competitive solutions to a wide range of industries.
Recent News
On 10th December 2019, Rolls-Royce Holdings announced that its Director Non-Executive, Bradley Singer, on 9th December 2019 had stepped down from his position.
Trading Update
On 7th November 2019,Rolls-Royce Holdings announced its Trading update. Since the H1 FY2019, the company’s trading improved but the company expects its operating profit and FCF for the full year to be on the lower side of the set guidance. The company expected its FCF to be around GBP 1 billion in the year 2020, driven by operational efficiency improvements, restructuring benefits, disciplined approach to capital allocationand reduction in inventory.
Financial Highlights – H1 Financial Year 2019 (30th June 2019, £ million)
In the first half of the financial year 2019, the company’s underlying revenue rose by 7 per cent to £7,353 million as compared with the corresponding period of the last year, while reported revenue surged by 5 per cent to £7,883 million in H1 FY2019. Revenue surged because of an increase in the Underlying ITP Aero (up 23%), Civil Aerospace revenue (up 11%), Defence (up 2%), and Power Systems (up 6%). Underlying operating profit saw an improvement of 32 per cent from the previous year same period data. For the first half of 2019, underlying loss per share was 1.6 pence against the earnings per share of 2.5 pence in H1 FY2018, while reported loss per share stood at 48 pence in H1 FY2019.
Share Price Performance
.png)
Daily Chart as at 20th December 2019, before the market close (Source: Thomson Reuters)
On 20th December 2019, Rolls-Royce Holdings Plc shares were trading at GBX 696.20 at the time of writing before the market close (at 9:35 AM GMT), up by 0.06 per cent against the previous day closing price. Stock's 52 weeks High and Low are GBX 989.47/GBX 679.80.The company’s stock has given investors 1.43 per cent of a positive return in the last week.
Valuation Methodology
.png)
*Peers: BAE Systems PLC, Meggitt PLC, Airbus SE & Leonardo SpA.
Conclusion
Driven by steady performance in Defence and ITP Aero and strong growth from Civil Aerospace and Power Systems, underlying financial results were ahead of expectations. For the 2019 Full Year, the company expects to achieve its underlying operating profit and free cash flow guidance of £700m +/- £100m, as it aims to bring down commercial and administrative costs and improve its engineering efficiency through the restructuring programme undertaken by it. In FY2020, the company plans to generate at least £1 billion of free cash flow. The company reported a decent order intake year-to-date at Power Systems and continues to see a healthy market environment. After a period of substantial investment, the company stay devoted to delivering enhanced returns and will continue to invest in the innovation as needed to realise the long-term ambition to be the world’s foremost industrial technology company.
Over the course of 4 years (FY14 - FY18), the company’s revenue surged from GBP 13,736 million in FY14 to GBP 15,729 million in FY18. Compounded annual growth rate (CAGR) stood at 3.45 per cent.
Based on the healthy prospects and supported by valuation done using the above method, we have given a "BUY" recommendation at the current price of GBX 692.20 (as on 20th December 2019, before the market close at 8:20 AM GMT), with high single-digit upside potential, based on 8.15x NTM Price/Cash Flow (approx.) on FY19E cash flow per share (approx.).
Burford Capital Ltd
Burford Capital Ltd (LON: BUR) is the provider of funds and investment management services to the legal market. Total headcount is of around 80 people working in the US, Europe and Asia-Pacific, who works with clients globally.
Financial Highlights – H1 Financial Year 2019 (30 June 2019, US$’000)
In the first half of the financial year 2019, the company’s reported litigation investment income increased by 36 per cent to $264,992 thousand from $195,197 thousand in H1 FY2018. The company’s total income surged by 40 per cent from $205,205 thousand in H1 FY2018 to $287,043 thousand in H1 FY2019, mainly driven by an increase in income from investment, new initiative income and other income in the current half-yearly result. In H1 FY19, the operating profit was $251,194 thousand versus $182,720 thousand in H1 FY2018. The basic profit per ordinary share stood at 100.84 cents for H1 FY19 against 77.23 cents in H1 FY18.
Share Price Performance
.png)
Daily Chart as at 20th December 2019, before the market close (Source: Thomson Reuters)
On 20th December 2019, Burford Capital Ltd shares were trading at GBX 728.00 at the time of writing before the market close (at 10:00 AM GMT), up by 0.41 per cent against the previous day closing price. Stock's 52 weeks High and Low are GBX 2,045.00/GBX 380.20.The company’s stock has given investors 0.21 per cent of a negative return in the last week.
Valuation Methodology
.png)
*Peers: Man Group PLC, Schroders PLC, and Standard Life Aberdeen PLC.
Conclusion
In the previous period, the company was exposed to heightened risk and volatility. The company does not anticipate any significant negative impact of Brexit. Three bond issuances are denominated in Sterling, and thus Burford is exposed to currency risk. The company also has a minority of its investments denominated in currencies other than US dollars. The company has shown decent financial performance in the first half of the financial year 2019. Burford Capital Ltd is continuously investing in growing its operations and is planning to expand its product offerings in the near future.
Over the course of 4 years (FY14 - FY18), the company’s revenue surged from USD 82 million in FY14 to USD 425 million in FY18. Compounded annual growth rate (CAGR) stood at 50.88 per cent.
Based on the decent prospects which are supported by valuation done using the above method, we have given a “SPECULATIVE BUY” recommendation at the current price of GBX 719.00 (as on 20th December 2019, before the market close at 8:15 AM GMT) with single-digit upside potential based 1.32x NTM Price/Book Value (approx.) on FY19E book value per share (approx.).
IQE Plc
IQE Plc (LON: IQE) is a designer and manufacturer of epiwafer products driving connected 5G technologies and is recognised as the leading global supplier of advanced wafer products and wafer services to the semiconductor industry, with a global footprint spanning Europe, Asia and the USA.
Trading Update
In the trading update for the full year ended 31 December 2019, the company reported that a mid-single-digit adjusted operating loss was now expected due to revenues being slightly below the previous guidance range to between £136 million and £142 million, compared to the previous guidance range of £140 million to £160 million. The net debt position at year-end is expected to be between £15 million to £20 million, and capex would be towards the bottom end of the previous guidance of £30-40 million.
Share Price Performance

Daily Chart as at 20th December 2019, before the market close (Source: Thomson Reuters)
On 20th December 2019, IQE Plc shares were trading at GBX 47.36 at the time of writing before the market close (at 10:20 AM GMT), down by 0.96 per cent against the previous day closing price. Stock's 52 weeks High and Low are GBX 99.84/GBX 40.86.The company’s stock has given investors 0.42 per cent of a negative return in the last month.
Valuation Methodology

*Peers: Solon Se, Manz AG, SDL Plc, NCC Group Plc and Dialog Semiconductor Plc.
Conclusion
Driven by an expanding Asian market opportunities for both Photonics and Wireless products, demand for GaN to meet accelerating 5G infrastructure deployments, expected content gains in an expanding market for 3D sensing, the company remained optimistic about a return to growth but noted that outlook for the year 2020 included a seasonally weak Q1 data. Moreover, it has made significant strategic and operational progress with its global expansion projects and remained confident about its ability to adapt to global supply chain shifts, coupled with a unique breadth of compound semiconductor materials experience and IP portfolio.
Over the course of 4 years (FY14 - FY18), the company’s revenue surged from GBP 112 million in FY14 to GBP 156.3 million in FY18. Compounded annual growth rate (CAGR) stood at 8.69 per cent.
Based on the decent prospects which are supported by valuation done using the above method, we have given a “SPECULATIVE BUY” recommendation at the current price of GBX 47.00 (as on 20th December 2019, at 8:15 AM GMT) with single-digit upside potential based 1.35x NTM Price/Book Value (approx.) on FY19E book value per share (approx.).
Victoria Oil & Gas Plc
Victoria Oil & Gas Plc (LON: VOG) is a domestic energy supplier. The group is engaged in the gas distribution, exploration, and production business in Cameroon. It also markets the sale of hydrocarbons and other related activities. It operates in the UK, Russia, the British Virgin Islands, Guernsey, Kazakhstan and Cyprus.
Recent News
On 14th November 2019, Victoria Oil and Gas announced that its independent director non-executive, John Knight had resigned from his position to on other business obligations.
Financial Highlights – H1 Financial Year 2019 (30th June 2019, USD, thousand)
In the first half of the financial year 2019, the company’s reported revenue increased to $10.68 million as compared with the corresponding period of the last year driven by the renewal of the ENEO (ENEO Cameroon S.A.) gas sale agreement in December 2018. For the reporting period, the underlying EBITDA rose to $3.7 million against the $0.03 million in the prior period, due to an increase in revenues. Cash generated from operating activities prior to movements in working capital stood at $4.2 million in H1 FY19. On 30th June 2019, the net debt stood at $5.9 million, a decrease from the previous year data (31 December 2018: $17.4 million). Average daily Logbaba field gross production rate surged by 190 per cent to 9.9mmscfd in H1 FY19.
Share Price Performance
.png)
Daily Chart as at 20th December 2019, before the market close (Source: Thomson Reuters)
On 20th December 2019, Victoria Oil & Gas Plc shares were trading at GBX 6.28 at the time of writing before the market close (at 11:42 AM GMT), down by 0.16 per cent against the previous day closing price. Stock's 52 weeks High and Low are GBX 29.36/GBX 6.00.The company’s stock has given investors 16.69 per cent of a negative return in the last month.
Conclusion
Some of the risks which can impact business operations are capital constraints, global economic volatility, commodity price risk, legal compliance regulatory or litigation risk, adverse market sentiment, political and country risk. In H1 FY19, the company’s top-line performance has improved, and the profitability remained in the negative zone. Though the company has reduced its net debt which resulted in some improvement in the financial performance. The company expects to finalise a new agreement with ENEO related to payment guarantee security in the coming few days. The focus is now back on growing sales and signing new grid power contracts. In the current period, the company also increased industrial customer gas consumption for thermal use and industrial customer gas for power usage. International Organization for Standardization compliance ("ISO") 9001, 14001 & 45001 audits successfully completed, emphasising the group's commitment to global standards in its management systems.
Based on the above rationale, we have given a “SPECULATIVE BUY” recommendation at the current price of GBX 6.12 (as on 20th December 2019, before the market close at 10:35 AM GMT).
*All forecasted figures and Peer information have been taken from Thomson Reuters.Currency exchange rate taken for 1 USD = 0.76715 GBP.
Disclaimer
PLEASE BE ADVISED THAT YOUR CONTINUED USE OF THIS SITE OR THE INFORMATION PROVIDED HEREIN SHALL INDICATE YOUR CONSENT AND AGREEMENT TO THESE TERMS.
References to ‘Kalkine’, ‘we’, ‘our’ and ‘us’ refer to Kalkine Limited.
This website is a service of Kalkine Limited. Kalkine Limited is a private limited company, incorporated in England and Wales with registration number 07903332.
The article has been prepared for informational purposes only and is not intended to be used as a complete source of information on any particular company. Kalkine is not responsible for material posted on this website and does not guarantee the content, accuracy, or use of the content in this site. No advice or information, whether oral or written, obtained by you from Kalkine or through or from the service shall create any warranty not expressly stated.
Kalkine do not offer financial advice based upon your personal financial situation or goals, and we shall NOT be held liable for any investment or trading losses you may incur by using the opinions expressed in our publications, market updates, news alerts and corporate profiles. Kalkine does not in any way endorse or recommend individuals, products or services that may be discussed on this site. You should discuss your portfolios and the risk tolerance level appropriate for your personal financial situation, with a professional licensed financial planner and adviser.

 CA
 NZ
 US
 AU
 IND

 UK
 Please wait processing your request...