Franco-Nevada Corporation
Franco-Nevada Corporation (NYSE: FNV) is a Canada-based gold-focused royalty and streaming company with diversified portfolio of cash-flow producing assets. The Company’s business model provides investors with gold price and exploration optionality while limiting exposure to cost inflation.
Recent Financial and Business Updates:
- Financial Strength and Stability: As of September 30, 2023, FNV boasts a robust financial position with no outstanding debt and an impressive USD 2.3 billion in available capital. During the quarter, FNV demonstrated its financial prowess by generating a substantial USD 236.0 million in operating cash flow. This solid foundation is further underscored by FNV's achievement of 16 consecutive annual dividend increases, with a quarterly dividend payout of USD 0.34 per share.
- Industry-Leading ESG Commitment: FNV takes pride in its sector-leading Environmental, Social, and Governance (ESG) practices, as recognized by global rating agencies. FNV's commitment to responsible mining is evident through its accolades, including being ranked as the #1 gold company by Sustainalytics, receiving an AA rating from MSCI, and earning Prime status from ISS ESG. FNV actively supports the World Gold Council's Responsible Gold Mining Principles and strives to achieve 40% diverse representation at the Board and top leadership levels collectively by 2025.
- Diverse and Long-Life Portfolio: FNV's portfolio stands out as the most diverse in terms of assets, operators, and countries. With core precious metal streams on world-class copper assets surpassing acquisition expectations, FNV's reserves and resources exhibit a long-life trajectory. FNV continues to position itself for growth and optionality, with ongoing mine expansions, new mines, and exposure to significant mineral endowments in gold, copper, and nickel.
- Q3 2023 Performance Highlights: In the third quarter of 2023, FNV's revenue reached USD 309.5 million, marking a 1.7% increase from the same period in 2022. This growth was attributed to higher Gold Equivalent Ounces (GEOs) from FNV's Precious Metal assets and increased gold prices, offsetting the decline in revenue from FNV's Diversified assets due to lower oil and gas prices. Notably, Precious Metal revenue accounted for 77.8% of FNV's total revenue, with substantial contributions from the Americas.
- ESG Initiatives and Social Impact: FNV's commitment to ESG extends beyond accolades, as demonstrated by its support for mining engineering students through the Franco-Nevada Diversity Scholarship program. Additionally, FNV has forged strategic partnerships, exemplified by its funding to the Canadian Institute of Mining, Metallurgy, and Petroleum (CIM), contributing to industry initiatives. FNV is actively engaged with its operators in community and ESG initiatives, reflecting its dedication to sustainable and socially responsible practices.
- Cobre Panama Mine Contract Update: Regarding the Cobre Panama mine, the Panamanian government's intention to hold a popular consultation on Law 406, which approved the revised mining concession contract, was announced on October 29, 2023. While the proposed consultation and repeal of Law 406 were not approved, ongoing legal challenges to the constitutionality of Law 406 are being reviewed by the Supreme Court of Justice. Despite protests causing disruptions on-site, production at the Cobre Panama mine remains uninterrupted as of now.
- Strategic Portfolio Additions: FNV continues to enhance its diverse portfolio through strategic acquisitions, including additional royalties on the Magino Gold Mine in Ontario, Canada, and royalties on the Wawa Gold Project in Ontario, Canada. Additionally, FNV's recent acquisitions include royalties on the Pascua-Lama Project in Chile and the Volcan Gold Project in Chile, reflecting its commitment to securing valuable assets worldwide.
- Q3 2023 Portfolio Updates: FNV's Precious Metal assets, including Cobre Panama, Guadalupe-Palmarejo, and MWS, delivered strong results, with GEOs sold totaling 125,337 in Q3 2023. Across various regions, FNV's assets exhibited both production growth and challenges, such as at Stillwater, Goldstrike, and Detour Lake. FNV's Diversified assets faced a revenue decline in Q3 2023, primarily due to lower oil and gas prices.
- Dividend Declaration: FNV's commitment to returning value to shareholders is evident in the declaration of a quarterly dividend of USD 0.34 per share. Shareholders of record on December 7, 2023, will receive the dividend on December 21, 2023, underscoring its dedication to rewarding investors.
Technical Observation (on the daily chart)
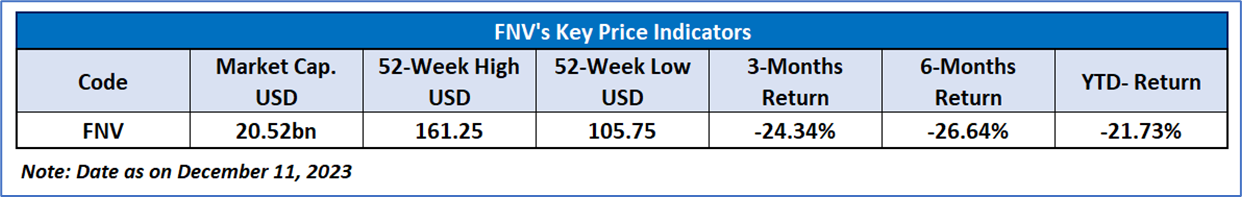
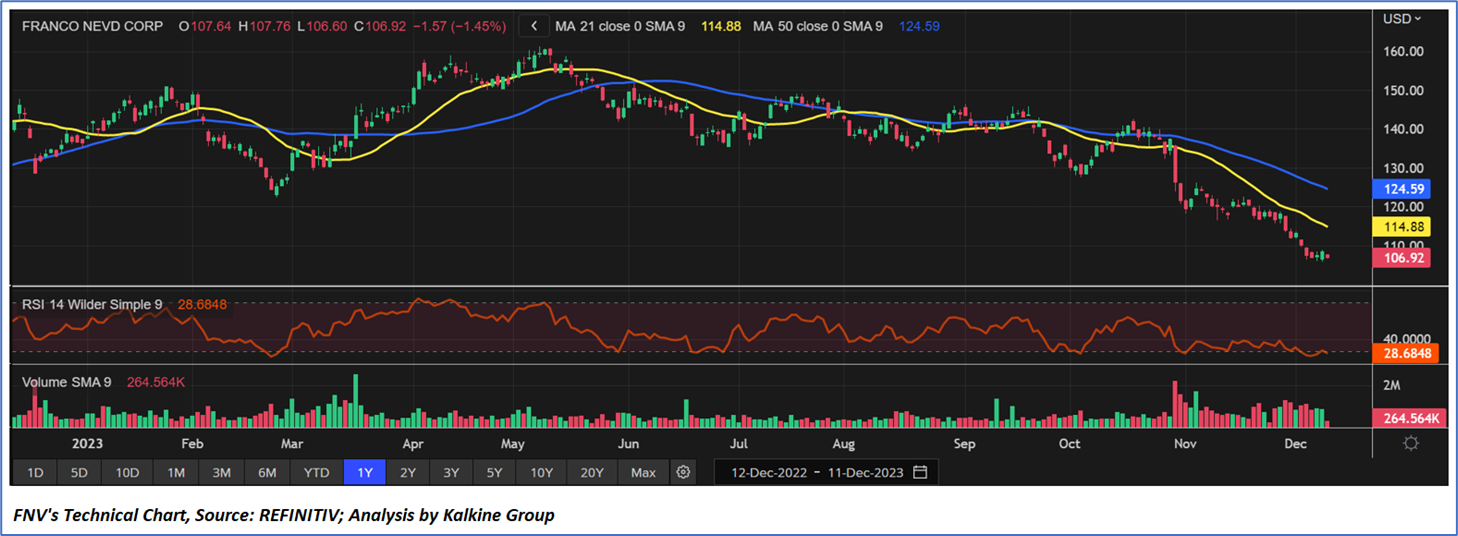
The stock reached its 52-week low of USD 105.75 on December 08, 2023. The Relative Strength Index (RSI) over a 14-day period stands at 28.68, currently in the oversold zone, with expectations of a short-term upside momentum or some consolidation. Additionally, the stock's current positioning is below both the 21-day Simple Moving Average (SMA) and the 50-day SMA, which may serve as dynamic short-term resistance levels.
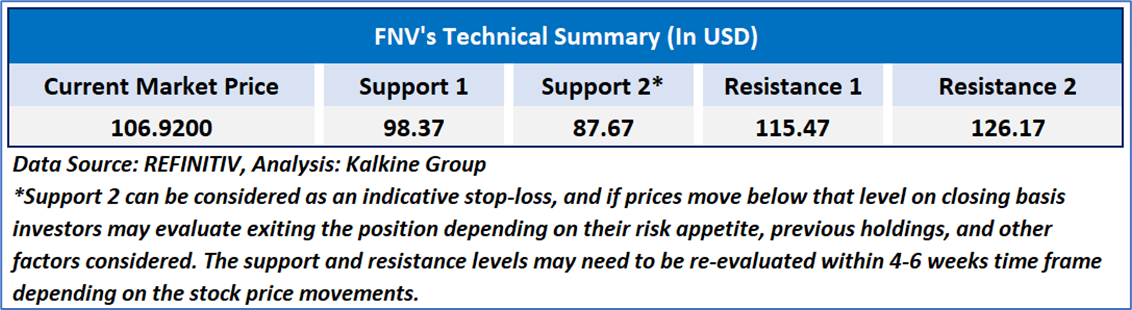
As per the above-mentioned price action, recent key business and financial updates, momentum in the stock over the last month, and technical indicators analysis, a ‘Buy’ rating has been given Franco-Nevada Corporation (NYSE: FNV) at its current price of USD 106.92 as on December 11, 2023, at 7:52 am PST.
Individuals can evaluate the stock based on the support and resistance levels provided in the report in case of keen interest taking into consideration the risk-reward scenario.
Markets are trading in a highly volatile zone currently due to certain macro-economic issues and prevailing geopolitical tensions. Therefore, it is prudent to follow a cautious approach while investing.
Related Risk: This report may be looked at from a high-risk perspective and a recommendation is provided for a short duration. This report is solely based on technical parameters, and the fundamental performance of the stocks has not been considered in the decision-making process. Other factors which could impact the stock prices include market risks, regulatory risks, interest rates risks, currency risks, social and political instability risks etc.
How to Read the Charts?
The yellow colour line reflects the 21-period simple moving average (SMA) while the blue line indicates the 50- period simple moving average (SMA). SMA helps to identify existing price trends. If the prices are trading above the 21-period and 50-period moving average, then it shows prices are currently trading in a bullish trend.
The orange colour line in the chart’s lower segment reflects the Relative Strength Index (14-Period) which indicates price momentum and signals momentum in trend. A reading of 70 or above suggests overbought status while a reading of 30 or below suggests an oversold status.
The red and green colour bars in the chart’s lower segment show the volume of the stock. The volume is the number of shares that changed hands during a given day. Stocks with high volumes are more liquid than stocks with lesser volume as liquidity in stocks helps with easier and faster execution of the order.
The Orange colour lines are the trend lines drawn by connecting two or more price points and used for trend identification purposes. The trend line also acts as a line of support and resistance.
Technical Indicators Defined: -
Support: A level at which the stock prices tend to find support if they are falling, and a downtrend may take a pause backed by demand or buying interest. Support 1 refers to the nearby support level for the stock and if the price breaches the level, then Support 2 may act as the crucial support level for the stock.
Resistance: A level at which the stock prices tend to find resistance when they are rising, and an uptrend may take a pause due to profit booking or selling interest. Resistance 1 refers to the nearby resistance level for the stock and if the price surpasses the level, then Resistance 2 may act as the crucial resistance level for the stock.
Stop-loss: It is a level to protect further losses in case of unfavourable movement in the stock prices.
The reference date for all price data, currency, technical indicators, support, and resistance levels is December 11, 2023. The reference data in this report has been partly sourced from REFINITIV.
Abbreviations
CMP: Current Market Price
SMA: Simple Moving Average
RSI: Relative Strength Index
USD: United States dollar
Note: Trading decisions require a thorough analysis by individual. Technical reports in general chart out metrics that may be assessed by individuals before any stock evaluation. The above are illustrative analytical factors used for evaluating the stocks; other parameters can be looked at along with additional risks per se. Past performance is neither an indicator nor a guarantee of future performance.
_12_11_2023_18_24_14_080860.jpg)
 Please wait processing your request...