Sunrun Inc.

RUN Details
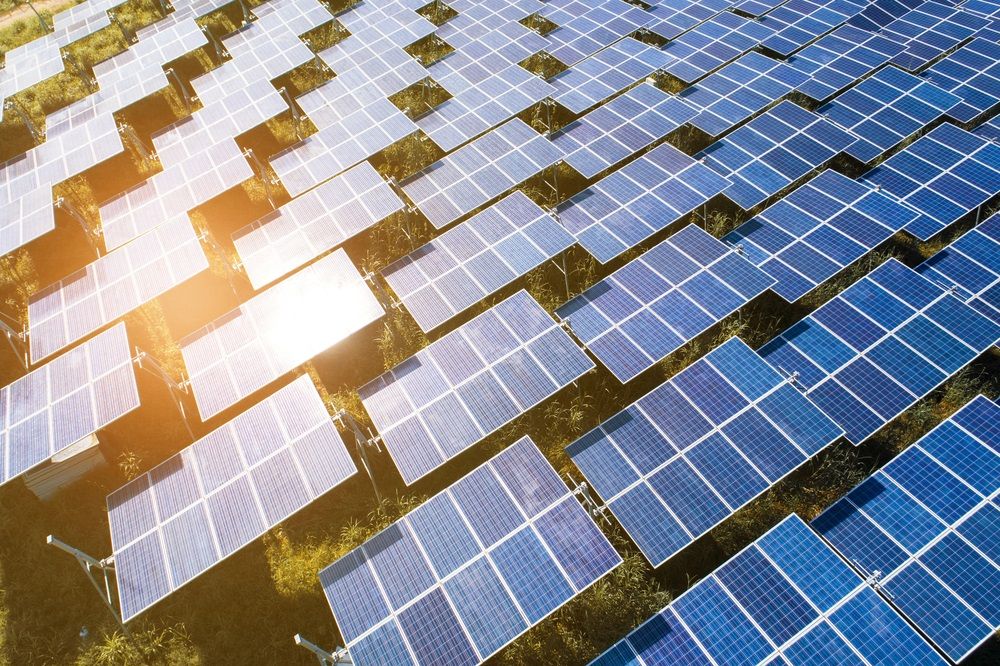
Sunrun Inc. (NASDAQ: RUN) is engaged in the design, development, installation, sale, ownership, and maintenance of residential solar energy systems in the US. The primary customers are residential homeowners. It also offers battery storage and solar energy systems.

Q2FY21 Result Performance for the Period Ended 30 June 2021 (Q2FY21)
- The revenue stood at $401.2 million in Q2FY21, up 121% YoY, primarily driven by an increase in customer agreements and incentives revenue to $219.5 million in Q2FY21, up 107% YoY, and Solar energy systems and product sales revenue to $181.7 million in Q2FY21, up 142% YoY.
- Subscriber Value stood at $34,519 in Q2FY21 while Creation Cost was $28,945 in Q2FY21. Net Subscriber Value stood at $5,574 in Q2FY21. Net Subscriber Margin in Q2FY21 was below than Q2FY20
- The company has added 26,110 customers in Q2FY21, including 21,894 subscriber additions that take its customer base to 599,743, up 19% YoY, as of 30 June 2021.
- Net loss stood at $41.2 million, or $0.20 per share, in Q2FY21.

Consolidated Income Statement (Source: Company Reports)
Key Update
As per the release dated 22 September 2021, the company priced the securitization of residential solar & battery systems. The transaction was put in place with both A- (Class A) and BB- (Class B) evaluated notes, while only the Class A notes were offered to investors. The Class A notes carry an early balance of $447.1 million and were priced at a yield of 2.28%, indicating a spread to the index swap rate of 120 bps.
Outlook
The company is working on a plan to deliver a break-out year. Hence, the management raised its growth guidance for solar energy capacity installed to be 30% in FY21 from its earlier forecast of 25%-30% growth for FY21. Further, it now anticipates achieving a total value generation in the ambit of $700-750 million in FY21 against its earlier guidance of over $750 million. The revised value generation is primarily driven by the adjustments of accelerated growth and timing of cost recognition. It anticipates cost synergies from the acquisition of Vivint Solar to be ~$120 million in FY21.
Key Risks
The company is exposed to the impact of COVID-19 related circumstances and the effective integration of Vivint Solar. Further, material declines in the retail price of electricity generated from utilities or other sources and changes in regulations and policies, among other factors are some other potential risks.
Valuation Methodology: EV/Sales Based Relative Valuation (Illustrative)

Technical Overview:
Daily Price Chart

Source: REFINITIV, Note: Purple color line reflects Relative Strength Index (14-Period)

Stock Recommendation
The company has delivered a 6-month and 9-month return of ~-31.20% and ~-38.26%, respectively. The stock is trading below the average of the 52-week high price of $100.93 and the 52-week low price of $37.42, which indicates a good opportunity for accumulation.
The stock has been valued using an EV/Sales multiple-based illustrative relative valuation and the target price so arrived reflects a rise of low double-digit (in % terms). A slight discount has been applied to EV/Sales Multiple (NTM) (Peer Average) considering its higher operating costs, negative net earnings in Q2FY21 as well as elevated debt levels.
Considering the aforementioned factors, we give a “Buy” recommendation on the stock at the current market price of $41.61 per share, down by 3.12% as of 29th September 2021.
Note 1: The reference data in this report has been partly sourced from REFINITIV.
Note 2: Investment decisions should be made depending on the investors’ appetite on upside potential, risks, holding duration, and any previous holdings. Investors can consider exiting from the stock if the Target Price mentioned as per the analysis has been achieved and subject to the factors discussed above alongside support levels provided.
Technical Indicators Defined:-
Support: A level where-in the stock prices tend to find support if they are falling, and downtrend may take a pause backed by demand or buying interest.
Resistance: A level where-in the stock prices tend to find resistance when they are rising, and uptrend may take a pause due to profit booking or selling interest.
Stop-loss: It is a level to protect further losses in case of unfavourable movement in the stock prices.
Disclaimer
References to ‘Kalkine’, ‘we’, ‘our’ and ‘us’ refer to Kalkine Limited.
This website is a service of Kalkine Limited. Kalkine Limited is a private limited company, incorporated in England and Wales with registration number 07903332. Kalkine Limited is authorised and regulated by the Financial Conduct Authority under reference number 579414.
The article has been prepared for informational purposes only and is not intended to be used as a complete source of information on any particular company. No advice or information, whether oral or written, obtained by you from Kalkine or through or from the service shall create any warranty not expressly stated. Kalkine does not intend to exclude any liability which it is not permitted to exclude under applicable law or regulation.
Kalkine does not offer financial advice based upon your personal financial situation or goals, and we shall NOT be held liable for any investment or trading losses you may incur by using the opinions expressed in our publications, market updates, news alerts and corporate profiles. Kalkine does not intend to exclude any liability which it is not permitted to exclude under applicable law or regulation. Kalkine’s non-personalised advice does not in any way endorse or recommend individuals, investment products or services for your personal financial situation. You should discuss your portfolios and the risk tolerance level appropriate for your personal financial situation, with a professional authorised financial planner and adviser. You should be aware that the value of any investment and the income from it can go down as well as up and you may not get back the amount invested.
Kalkine Media Limited, an affiliate of Kalkine Limited, may have received, or be entitled to receive, financial consideration in connection with providing information about certain entity(s) covered on its website.

 CA
 NZ
 US
 AU
 IND

 UK
 Please wait processing your request...