Alibaba Group Holding Ltd
Alibaba Group Holding Ltd (NYSE: BABA) provides technology infrastructure and marketing platforms. The Company operates through seven segments. China Commerce segment includes China retail commerce businesses such as Taobao, Tmall and Freshippo, among others, and wholesale business.

Recent Financial and Business Updates:
BUSINESS HIGHLIGHTS
- Robust Financial Performance:
- Revenue reached RMB234,156 million (USD 32,292 million), marking a 14% YoY increase.
- Income from operations surged to RMB42,490 million (USD 5,860 million), witnessing a substantial 70% YoY growth.
- Adjusted EBITA, a non-GAAP measure, experienced a notable 32% YoY increase, reaching RMB45,371 million (USD 6,257 million).
- Net Income Growth:
- Net income attributable to ordinary shareholders amounted to RMB34,332 million (USD 4,735 million).
- Non-GAAP net income showed a remarkable 48% YoY increase, reaching RMB44,922 million (USD 6,195 million).
- Operational Cash Flow:
- Net cash provided by operating activities rose by 34%, totaling RMB45,306 million (USD 6,248 million).
- Free cash flow, a non-GAAP liquidity measure, increased significantly by 76% to RMB39,089 million (USD 5,391 million).
BUSINESS AND STRATEGIC UPDATES
- Organizational Restructuring:
- A new organizational structure was implemented starting June 30, 2023, with the company acting as a holding entity for six major business groups and various other businesses.
- The six major business groups are Taobao and Tmall Group, Alibaba International Digital Commerce Group, Local Services Group, Cainiao Smart Logistics Network Limited, Cloud Intelligence Group, and Digital Media and Entertainment Group.
- Taobao and Tmall Group Strategy:
- Focused on user-centric strategies, building a prosperous ecosystem, and achieving technology-driven innovation.
- Key initiatives include increasing media content, enhancing price competitiveness, and catering to high-frequency everyday necessities through neighborhood businesses.
- Alibaba International Digital Commerce Group Performance:
- Recorded a 25% YoY combined order growth for retail businesses.
- AliExpress, Lazada, and Trendyol reported strong order growth, showcasing positive trends in user engagement and monetization.
- Local Services Group Highlights:
- Achieved a 30% YoY revenue growth, reaching RMB14,450 million (USD 1,993 million).
- me and Amap experienced over 35% YoY order growth.
- Cainiao Smart Logistics Network:
- Generated a 34% YoY revenue growth, amounting to RMB23,164 million (USD 3,194 million).
- Expanded international fulfillment services and achieved operational milestones with the launch of "5-Day Global Delivery."
- Cloud Intelligence Group Performance:
- Reported a 4% YoY revenue growth for the quarter, reaching RMB25,123 million (USD 3,465 million).
- Alibaba Cloud demonstrated growth in storage, networks, and AI computing-related products.
- Digital Media and Entertainment Group Highlights:
- Achieved a revenue of RMB5,381 million (USD 742 million), reflecting growth in both online and offline entertainment businesses.
- Youku's subscription revenue grew 5% YoY, and Alibaba Pictures reported strong box office performance.
- ESG Initiatives:
- Published the 2023 Environmental, Social, and Governance Report, showcasing progress and performance in key ESG dimensions.
- Achieved significant reductions in operational greenhouse gas emissions and drove considerable emission reduction across the business ecosystem.
- Repurchased 35.6 million ADSs for USD 3.1 billion during the quarter.
- As of June 30, 2023, 20.4 billion ordinary shares were outstanding, with USD 16.3 billion remaining under the current share buyback program authorized by the Board.
- Ant Group Share Repurchase:
- Received notice from Ant Group regarding a proposed share repurchase.
- Decided not to sell any shares to Ant Group under the proposed share repurchase, pending completion of the transactions.
- Alibaba Group Holding Limited has disclosed its intention to release unaudited financial results for the quarter concluding on September 30, 2023. This disclosure is scheduled before the commencement of the U.S. market on Thursday, November 16, 2023. Subsequently, a conference call to deliberate on the financial outcomes is slated to take place at 7:30 a.m. U.S. Eastern Time (8:30 p.m. Hong Kong Time) on the same day.
Technical Observation (on the daily chart)
The price of BABA stock has shown a consistent downward trend since making 52-week high on January 26, 2023, correcting around 31.57%. The RSI (14 period) momentum indicator is currently up trending with the value of 48.63, with expectations of some consolidation or a further continuation of an uptrend. Moreover, the price is currently positioned above the 21-day SMA and below 50-day SMA trend-following indicators, which may act as dynamic short-term support and resistance levels respectively.
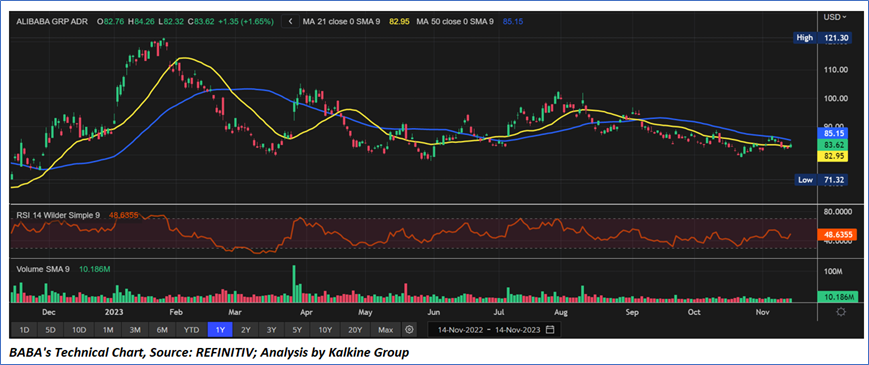

As per the above-mentioned price action, recent key business and financial updates, momentum in the stock over the last month, and technical indicators analysis, a ‘Buy’ rating has been given to Alibaba Group Holding Ltd (NYSE: BABA) at the current price of USD 83.62 as of November 14, 2023, at 08:20 am PST.
Individuals can evaluate the stock based on the support and resistance levels provided in the report in case of keen interest taking into consideration the risk-reward scenario.
Markets are trading in a highly volatile zone currently due to certain macro-economic issues and prevailing geopolitical tensions. Therefore, it is prudent to follow a cautious approach while investing.
Related Risk: This report may be looked at from a high-risk perspective and a recommendation is provided for a short duration. This report is solely based on technical parameters, and the fundamental performance of the stocks has not been considered in the decision-making process. Other factors which could impact the stock prices include market risks, regulatory risks, interest rates risks, currency risks, social and political instability risks etc.
How to Read the Charts?
The Green colour line reflects the 21-period simple moving average (SMA) while the red line indicates the 50- period simple moving average (SMA). SMA helps to identify existing price trends. If the prices are trading above the 21-period and 50-period moving average, then it shows prices are currently trading in a bullish trend.
The Black colour line in the chart’s lower segment reflects the Relative Strength Index (14-Period) which indicates price momentum and signals momentum in trend. A reading of 70 or above suggests overbought status while a reading of 30 or below suggests an oversold status.
The Blue colour bars in the chart’s lower segment show the volume of the stock. The volume is the number of shares that changed hands during a given day. Stocks with high volumes are more liquid than stocks with lesser volume as liquidity in stocks helps in easier and faster execution of the order.
The Orange colour lines are the trend lines drawn by connecting two or more price points and used for trend identification purposes. The trend line also acts as a line of support and resistance.
Technical Indicators Defined: -
Support: A level at which the stock prices tend to find support if they are falling, and a downtrend may take a pause backed by demand or buying interest. Support 1 refers to the nearby support level for the stock and if the price breaches the level, then Support 2 may act as the crucial support level for the stock.
Resistance: A level at which the stock prices tend to find resistance when they are rising, and an uptrend may take a pause due to profit booking or selling interest. Resistance 1 refers to the nearby resistance level for the stock and if the price surpasses the level, then Resistance 2 may act as the crucial resistance level for the stock.
Stop-loss: It is a level to protect further losses in case of unfavourable movement in the stock prices.
The reference date for all price data, currency, technical indicators, support, and resistance levels is November 14, 2023. The reference data in this report has been partly sourced from REFINITIV.
Abbreviations
CMP: Current Market Price
SMA: Simple Moving Average
RSI: Relative Strength Index
USD: United States dollar
Note: Trading decisions require a thorough analysis by individual. Technical reports in general chart out metrics that may be assessed by individuals before any stock evaluation. The above are illustrative analytical factors used for evaluating the stocks; other parameters can be looked at along with additional risks per se. Past performance is neither an indicator nor a guarantee of future performance.

 Please wait processing your request...