.png)
Carnival Plc
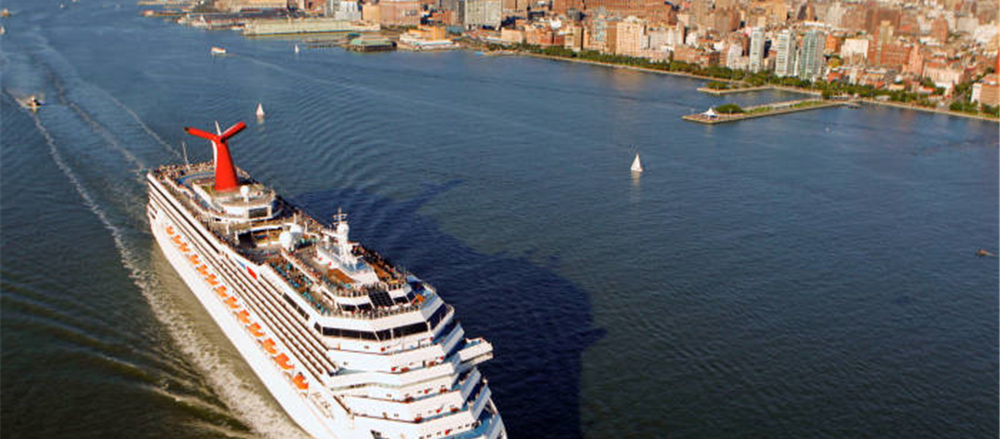
Carnival Plc (CCL) is a leisure travel group that operates in Europe, Asia, North America, and Australia. The company split its business activities into four operating segments. Carnival Cruise Line, Holland America Line, Seabourn, Costa, and AIDA are few of the brand name that operates under Carnival Plc. The company had a total of 102 ships visiting over 700 ports globally. The company is having an employee base of over 120,000 people catering to the needs of 11.5 million guests per year.
Recent News
On 14th October 2019, Carnival announced the declaration of a quarterly dividend of 0.50 cents per share. The board approved recorded date for a dividend of 22nd November 2019 and 13th December 2019 as a payment date.
Financial Highlights - Q3 Financial Year 2019 (31st August 2019, $, million)
.png)
(Source: Quarterly Report, Company Website)
For the nine months of the financial year 2019, the company’s reported revenue was at $16,043 million as against $14,425 million for 9M FY2018. The increase in revenue was driven by an increase in revenue from Cruise and Tour and other businesses for the period. For 9M in FY2019, the company’s operating income stood at $2,791 million versus $2,772 million for 9M FY2018. The company’s PBT (Profit before tax) stood at $2,624 million in the first nine months of the financial year 2019 as against $2,699 million in the first nine months of the financial year 2018. The company’s PAT (Profit after tax) stood at $2,567 million in the first nine months of the financial year 2019 as against $2,659 million in the first nine months of the financial year 2018. The basic earnings per share for 9M FY2019 stood at $3.72 as against $3.73 in 9M FY2018. The diluted earnings per share for 9M FY2019 stood at $3.71 as against $3.72 in 9M FY2018.
Share Price Performance
.png)
Daily Chart as at 18th October 19, before the market close (Source: Thomson Reuters)
On 18th October 2019, Carnival Plc shares were trading at GBX 3,053.00 at the time of writing before the market close (at 11:24 AM GMT), down by 0.77 per cent against the previous day closing price. Stock's 52 weeks High and Low are GBX 4,696.00/GBX 3,037.00.
Valuation Methodology
.png)
*Peers: William Hill Plc, SSP Group Plc, Cineworld Group Plc and Elegant Hotels Group Plc.
Conclusion
The company has shown decent financial performance for the period. The top-line performance for the period has improved, but the bottom-line performance has declined. The company is on track to deliver an improving return on invested capital and double-digit earnings growth.
Though the company had to cut earnings guidance due to a steep rise in fuel costs and the stronger dollar, the underlying business remains robust, reflected by strong bookings. Consistent demand trends build confidence in the prospects of the company. Over the course of 4 years (FY14 - FY18), the company’s revenue surged from $15,884 million in FY14 to $18,881million in FY18. Compound annual growth rate (CAGR) stood at 4.42 per cent.
Based on the decent prospects and supported by valuation done using the above method, we have given a “BUY” recommendation at the current price of GBX 3,053 (as on 18th October 2019, before the market close) with a single digit-upside potential based on 10.00x NTM Price/Earnings (approx.) on FY19E earnings per share (approx.).
Tremor International Ltd
Tremor International Ltd (TRMR) previously known as Taptica International Ltd, is a leading advertising technologies company having operations in more than 60 countries. The company offers advertising services, taking maximum advantage of the latest video and display technology to reach users for every app, service and brand. The company work for more than 450 leading advertisers including Amazon, Twitter and Disney etc.
Financial Highlights – H1 Financial Year 2019 (30th June 2019, USD, thousand)
.png)
(Source: Interim Report, Company Website)
In the first half of the financial year 2019, due tocontribution in revenue by RhythmOne for the 3 months period, the company’s revenue slightly increased to USD 144,899 thousand as against USD 144,027 thousand in H1 FY2018. With the increase in the operating expenses for the period, the company reported a loss from operations of USD 2,730 thousand in H1 FY2019 versus a profit from operations of USD 13,904 thousand in H1 FY2018. The company’s LBT (loss before tax) stood at USD 3,312 thousand in the first half of the financial year 2019 versus a PBT (Profit before tax) of USD 14,233 thousand in the first half of the financial year 2018. The company’s LAT (loss after tax) stood at USD 4,709 thousand in the first half of the financial year 2019 versus a PAT (Profit after tax) of USD 10,802 thousand in the first half of the financial year 2018. The basic loss per share in H1 FY2019 stood at 0.0476 cents versus basic earnings per share of 0.1612 cents in H1 FY2018. The diluted loss per share in H1 FY2019 stood at 0.0466 cents versus diluted earnings per share of 0.1553 cents in H1 FY2018.
Share Price Performance
.png)
Daily Chart as at 18th October 19, before the market close (Source: Thomson Reuters)
On 18th October 2019, Tremor International Ltdshares were trading at GBX 136.88 at the time of writing before the market close (at 12:43 PM GMT), down by 0.45 per cent against the previous day closing price. Stock's 52 weeks High and Low are GBX 345.00/GBX 73.20.
Valuation Methodology
.png)
*Peers: Be Heard Group Plc, Madvertise SA, Spaceandpeople Plc, NAHL Group Plc and Prismaflex International SA.
Conclusion
The company has shown a decline in financial performance in the first half of the financial year 2019. The company’s revenue remained on the flat side, and the bottom-line performance had declined significantly for the period.
The week performance had been offset by the contribution from recently acquired RhythmOne. The company’s business is highly cash generative with a strong balance sheet. The company is having a strong relationship with its clients and is helping them to exceed the forecasted figures. The company is also looking forward to growing through acquisitions, which will help in enhancing capabilities.
Over the course of 4 years (FY14 - FY18), the company’s revenue surged from USD 63.1 million in FY14 to USD 276.9 million in FY18. Compound annual growth rate (CAGR) stood at 44.73 per cent.
Based on the above rationale and the valuation done using the above method, we have given the "Speculative Buy" recommendation at the current price of GBX 136.88 (as on 18th October 2019, before the market close) with single-digit upside potential based on 4.40x NTM Price/Earnings (approx.) on FY19E earnings per share (approx.).
*All forecasted figures and Peers information has been taken from Thomson Reuters.Currency exchange rate taken for 1 USD = 0.7752 GBP
Disclaimer
PLEASE BE ADVISED THAT YOUR CONTINUED USE OF THIS SITE OR THE INFORMATION PROVIDED HEREIN SHALL INDICATE YOUR CONSENT AND AGREEMENT TO THESE TERMS.
References to ‘Kalkine’, ‘we’, ‘our’ and ‘us’ refer to Kalkine Limited.
This website is a service of Kalkine Limited. Kalkine Limited is a private limited company, incorporated in England and Wales with registration number 07903332.
The article has been prepared for informational purposes only and is not intended to be used as a complete source of information on any particular company. Kalkine is not responsible for material posted on this website and does not guarantee the content, accuracy, or use of the content in this site. No advice or information, whether oral or written, obtained by you from Kalkine or through or from the service shall create any warranty not expressly stated.
Kalkine do not offer financial advice based upon your personal financial situation or goals, and we shall NOT be held liable for any investment or trading losses you may incur by using the opinions expressed in our publications, market updates, news alerts and corporate profiles. Kalkine does not in any way endorse or recommend individuals, products or services that may be discussed on this site. You should discuss your portfolios and the risk tolerance level appropriate for your personal financial situation, with a professional licensed financial planner and adviser.

 CA
 NZ
 US
 AU
 IND

 UK
 Please wait processing your request...