
Safestore Holdings PLC
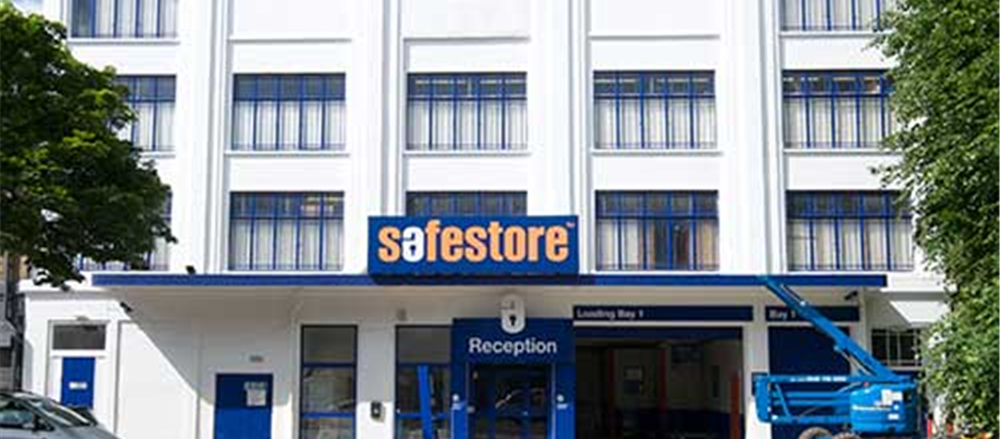
Safestore Holdings PLC (SAFE) is a Borehamwood, United Kingdom-headquartered self-storage provider. It is the largest provider of self-storage solutions in London & the UK and the second largest in Europe, 118 UK locations & 45 in London and a further 27 stores in Europe. The group offers short term storage, long term storage or seasonal self-storage options for household, business or student purposes, with flexible, secure and affordable solutions. The group is a constituent of the FTSE 250 index. The operations of the group are differentiated in two geographical segments, namely UK and Paris.
Trading Update
In the third quarter of the financial year 2019, group revenue in constant exchange rate basis grew by 4.8% to £38.2 million, while like-for-like revenue in Q3 in constant exchange rate basis increased 4.2% to £37.7 million. This reflected good performance in both the geographies, with like-for-like revenue in UK and Paris up by 4% and 6.1% respectively. Group’s like-for-like closing occupancy was up by 2.1 percentage points to 78.6%, and like-for-like average storage rate in Q3 in a constant exchange rate basis grew by 1.4% to £25.61. The financials remained on course to meet the full-year expectations of the management.
Financial Highlights (H1 2019, in £m)
.png)
(Source: Company Filings)
As the reported average rental rate for the period was higher by 1.5% to £26.30 than in H1 2018 (£25.91) and average occupancy during the period rose by 3.8% to 4.61 million square ft (H1 2018: 4.44 million square ft), reported revenue increased by 5.6% or £3.9 million during the period to £73.1 million while it increased by 5.9% at CER. Reflecting like-for-like closing occupancy growing by 1.6 percentage points to 72.6% in the period, the group reported a 5.6% increase in like-for-like revenue to £72.1 million, at a CER of 5.9%.
The reported underlying cost of sales rose by £1.3 million or 5.3% to £25.7 million in H1 2019, and the underlying cost of sales on a constant currency basis was up by 4.6% or £1.1 million, to £25.1 million (H1 2018: £24.0 million). Due to the decrease in the gain on investment properties, reported operating profit decreased by £41.4 million to £45.9 million in H1 2019 from £87.3 million in H1 2018.
Underlying EBITDA increased by 5.9% on a reported basis and 6.1% at CER to £41.4 million(H1 2018: £39.1 million), while underlying EBITDA on a like-for-like basis was up by 6.5% on a reported basis and 6.7% at CER to £41.2 million (H1 2018: £38.7 million).
Driven by the reduced gain on investment properties of £7.9 million (2018: gain of £51.8 million), profit before tax was reported at £38.2 million against £81.9 million in the prior year, while the profit after tax for the period was £34.4 million, compared with £84.5 million in H1 2018.
Adjusted Diluted EPRA earnings per share rose by 7.1% to 13.5 pence(H1 2018: 12.6 pence), while diluted earnings per share were 16.4 pence (H1 2018: 40.2 pence) and basic earnings per share were 16.4 pence (H1 2018: 40.3 pence).
Valuation Methodology
Method: Price/Earnings Approach (NTM)
.png)
Share Price Commentary

Daily Chart as at 12-September-19, before the market closed (Source: Thomson Reuters)
On 12 September 2019, at the time of writing the report (at 9:25 am GMT, before the market closed), SAFE stock was trading at GBX 652.00, up by 1.00 per cent against the previous day closing price. Stock's 52 weeks High and Low is GBX 686.50/GBX 493.00. The company’s stock beta was 0.80, reflecting less volatility as compared to the benchmark index. The outstanding market capitalisation was around £1.36 billion, with a dividend yield of 2.58 per cent.
Conclusion
With double-digit new let growth on a like-for-like basis on both markets, the group continues to capture growing levels of demand in the UK and in Paris, and the self-storage market remains resilient to macroeconomic uncertainty. Helped by strong free cash generation of the business and strong balance sheet with low cost of debt, the group seeks to continue to seize consolidation and acquisition opportunities. A key competitive advantage in a fragmented industry is the scale of business of the group – it is the leading provider of self-storage market in the Europe and UK – which enables it to invest in digital marketing platforms and service proposition.
Based on the above rationale, and supported by valuation undertaken using the above method, we have given a "HOLD" recommendation at the closing price of GBX 645.50 (as on 11 September 2019) based on 23.90x NTM Price/Earnings (approx.) on FY19E Earnings per share (approx.).
*Peers of the company are Hammerson PLC, Big Yellow Group PLC, Derwent London PLC and Great Portland Estates PLC
*All forecasted figures and peers have been taken from Thomson Reuters.
IGAS Energy PLC
IGAS Energy PLC (IGAS) is a London-headquartered leading onshore oil and gas exploration and production company which produces around 2,200 barrels of oil equivalent per day from over 100 sites across the country by extracting oil and gas trapped underground in basins and many other fields. The portfolio is primarily focused on the Weald Basin, East Midlands and the North West, with significant potential yet to be delivered from the assets. The operations of the business are differentiated in two operating segments, namely conventional and unconventional licenses.
Financial Highlights (H1 2019, in £m)

(Source: Company Filings)
In the first half of the financial year 2019, production averaged 2,360 boepd, which was at the upper end of the guidance range of 2,200 - 2,400 boepd. At an average pre-hedge realised price of £64.0/bbl (H1 2018: £68.3/bbl) and post hedge of £61.1/bbl (H1 2018: £57.7/bbl), oil sales were 388,757 barrels and sale of electricity was 9,000 Mwh (H1 2018: 398,618 barrels; 5,240 Mwh of electricity). The group reported revenues of £21.2 million in the period, which remained flat against the previous year (H1 2018: £21.1 million). During the period, cost of sales was £14.2 million (H1 2018: £13.6 million) and operating costs was £9.7 million (H1 2018: £10.3 million), while operating costs per barrel of oil equivalent were £20.5 (H1 2018: £26.6), partially helped by a change in classification of operating lease costs. Gross profit was recorded at £7.0 million, down from £7.5 million in H1 2018, while operating profit rose to £2.29 million during the current period from around £1.0 million in H1 2018, principally due to lower staff costs. Adjusted EBITDA in the period was £7.7 million (H1 2018: £6.0 million), and profit from continuing activities before tax was £0.65 million against a loss of £0.87 million reported in H1 2018. Basic earnings per share were 0.49p, against loss per share of 1.02p in H1 2018. Net assets were £162.9 million at 30 June 2019 (31 December 2018: £161.7 million), and cash and cash equivalents were £14.4 million (31 December 2018: £15.1 million).
Share Price Commentary

Daily Chart as at 12-September-19, before the market closed (Source: Thomson Reuters)
On 12 September 2019, at the time of writing the report (at 10:51 am GMT, before the market closed), IGAS stock was trading at GBX 51.9, up by 2.50 per cent against the previous day closing price. Stock's 52 weeks High and Low is GBX 125.63/GBX 48.60. The company’s stock beta was 0.65, reflecting less volatility as compared to the benchmark index. The outstanding market capitalisation was around £61.91 million.
Conclusion
Underlying cash operating costs per boe is expected to be under budget at $31/boeand net production is anticipated to average 2,200 - 2,400 boepd for the financial year 2019. While the company is making investments in further data acquisition, the successful development of shale gas resources has not been achieved, with no certainty of the same. The group has to navigate the uncertain and lengthy UK planning regime and is exposed to market price risk through fluctuations in the wholesale price of oil and gas and electricity. Moreover, as significant borrowings and revenue are in the dollar, depreciation in sterling impacts the bottom line numbers.
Based on the headwinds faced by the group, we have given a "WATCH" recommendation at the current price of GBX 51.90 (as on 12 September 2019), while we look for any upcoming catalysts in the near term.
Disclaimer
PLEASE BE ADVISED THAT YOUR CONTINUED USE OF THIS SITE OR THE INFORMATION PROVIDED HEREIN SHALL INDICATE YOUR CONSENT AND AGREEMENT TO THESE TERMS.
References to ‘Kalkine’, ‘we’, ‘our’ and ‘us’ refer to Kalkine Limited.
This website is a service of Kalkine Limited. Kalkine Limited is a private limited company, incorporated in England and Wales with registration number 07903332.
The article has been prepared for informational purposes only and is not intended to be used as a complete source of information on any particular company. Kalkine is not responsible for material posted on this website and does not guarantee the content, accuracy, or use of the content in this site. No advice or information, whether oral or written, obtained by you from Kalkine or through or from the service shall create any warranty not expressly stated.
Kalkine do not offer financial advice based upon your personal financial situation or goals, and we shall NOT be held liable for any investment or trading losses you may incur by using the opinions expressed in our publications, market updates, news alerts and corporate profiles. Kalkine does not in any way endorse or recommend individuals, products or services that may be discussed on this site. You should discuss your portfolios and the risk tolerance level appropriate for your personal financial situation, with a professional licensed financial planner and adviser.

 CA
 NZ
 US
 AU
 IND

 UK
 Please wait processing your request...