.png)
Oxford Instruments PLC
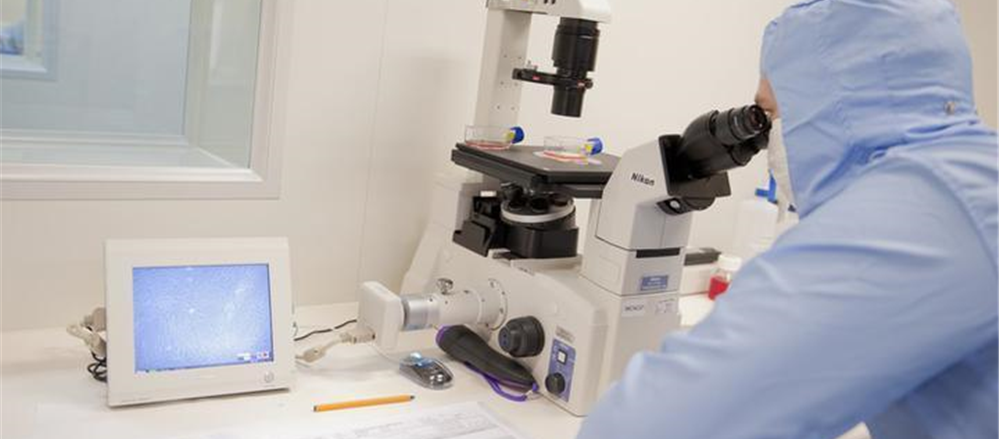
Oxford Instruments PLC (OXIG) is an Abingdon, United Kingdom-headquartered leading provider of high technology products, systems and tools to leading scientific research communities and industrial companies in the world to enable their analytical, manufacturing, monitoring and research goals across a wide range of applications. The group helps in achieving increased connectivity, improved health and leaps in scientific understanding by enabling its customers to accelerate their R&D, increase productivity and make new scientific discoveries by analysing and manipulating materials down to the atomic and molecular level. The operations of the group are differentiated in three operating segments, namely Materials & Characterisation, Research & Discovery, and Service & Healthcare.
Financial Highlights (H1 2020, in £m)
.png)
(Source: Company Filings)
The order book grew 8.9% on a reported basis and 6.0% at constant currency and at the end of the period, order book for future deliveries stood at £186.8 million (31 March 2019: £171.6 million) as reported orders increased by 6.4% to £173.3 million (2018: £162.9 million), an increase of 2.8% at constant currency. Revenue, excluding currency effects, increased by 9.1%, and reported revenue increased by 13.1% to £166.3 million (2018: £147.0 million), while the book-to-bill for the half year was 1.04. Gross profit increased by 11.2% to £82.2 million (2018: £73.9 million), representing a gross profit margin of 49.4%. Adjusted operating profit increased by 22.9% to £25.8 million (2018: £21.0 million) and adjusted operating margin increased by 120 basis points to 15.5% (2018: 14.3%), while adjusted profit before tax grew by 28.3% to £25.4 million (2018: £19.8 million), representing a margin of 15.3% (2018: 13.5%). The company reported profit before tax of £18.0 million (2018: £11.6 million) and an operating profit of £18.4 million (2018: £13.7 million), while the company proposed to increase the interim dividend by 7.9% to 4.10 pence (2018: 3.80 pence).
Valuation Methodology
Method: Price/Earnings Approach (NTM)
.png)
Share Price Commentary
.png)
Daily Chart as at 13-November-19, before the market closed (Source: Thomson Reuters)
On 13 November 2019, at the time of writing (before the market closed, GMT 10:29 am), OXIG shares were trading at GBX 1,482, down by 1.46% against the previous day’s closing price. Stock's 52 weeks High and Low is GBX 1,504.00/GBX 813.00. The company's stock beta was 1.10, reflecting more volatility as compared to the benchmark index. Total outstanding market capitalisation was around £863.43 million, with a dividend yield of 0.98%.
Conclusion
The company is experiencing softening in silicon semiconductor, electronics and automotive production markets, though it was more than offset by new growth opportunities from academic and commercial customers in the latest financial period. Due to the potential disruption to the supply chain that could arise as a result of a possible no-deal Brexit,uncertainty over the potential impact of Brexit remained due to the continuing lack of clarity relating to Brexit. Due to the increasing risk of an economic downturn, government expenditure may become constrained in key markets, which might lead to a reduction in the research funding in key markets, along with changes in the geopolitical landscape or a global trade war.
Based on the headwinds faced by the group, we have given a "WATCH" recommendation at the closing price of GBX 1,504.0 (as on 12 November 2019), while we look for any upcoming catalysts in the near term.
Carr's Group PLC
Carr's Group PLC (CARR) is a Carlisle, United Kingdom-headquartered international leader in manufacturing value added products and solutions, which offers a range of services including the design, manufacture and supply of bespoke equipment and remote handling machinery. It supplies over 50 countries around the world, and its facility footprint across its two divisions spans the UK, Europe and North America, with robust market positions and market leading brands in the Engineering and Agriculture sectors.
Recent Development
The company on 9 October 2019 announced that in line with the succession plan announced in December 2018, Chris Holmes would stand down at the AGM on 7 January 2020, and he would be replaced with Peter Page, who was appointed as Non-Executive Director and Chairman Designate with effect from 1 November 2019.
Financial Highlights (FY2019, in £m)

(Source: Company Filings)
As revenue from Agriculture was down by 0.6% to £357.4 million (FY 2018: £359.6 million), and revenue from Engineering was up by 6.7% to £46.5 million (FY 2018: £43.6 million), revenue for the year increased by 0.2% to £403.9 million (FY 2018: £403.2 million). Reported operating profit was up 4.8% to £17.2 million (FY 2018: £16.4 million), while Agriculture contributed £13.6 million (FY 2018: £13.4 million) and Engineering £5.3 million (FY 2018: £4.1 million) in adjusted operating profit, helping the company to record 8.4% rise to £18.9 million (FY 2018: £17.5 million). Reported profit before tax was up 5.2% at £16.3 million (FY 2018: £15.5 million), and adjusted profit before tax was up 9.0% to £18.0 million (FY 2018: £16.6 million). Adjusted earnings per share, excluding amortisation of acquired intangible assets and non-recurring items, was up by 5.0% to 14.6p (FY 2018: 13.9p), while fully diluted earnings per share were 12.8p (FY 2018: 12.7p) and basic earnings per share were up by 0.8% to 13.1p (FY 2018: £13.0p). Despite a small cash inflow of £3.6 million, net debt has increased by £12.0 million in relation to the acquisitions, resulting in net debt at 31 August 2019 of £23.8 million (FY 2018: £15.4 million).
Share Price Commentary

Daily Chart as at 13-November-19, before the market closed (Source: Thomson Reuters)
On 13 November 2019, at the time of writing (before the market closed, GMT 10:32 am), CARR shares were trading at GBX 147, up by 2.2% against the previous day’s closing price. Stock's 52 weeks High and Low are GBX 179.85/GBX 128. The company's stock beta was 0.49, reflecting less volatility as compared to the benchmark index. Total outstanding market capitalisation was around £133.85 million, with a dividend yield of 3.26%.
Conclusion
While the management of the group has confidence in the business due to its strong order book, it expects a reduced activity in Global Technical Services in the coming year due to contract phasing. The uncertainty around Brexit has started to hurt the customers of the group as farmer confidence is becoming increasingly impacted in the UK, and future government policy and support for the agricultural sector will potentially impact on customers as part of its customer base is inherently reliant on agricultural subsidies from the EU. Moreover, for some areas of the business, the company imports raw materials from within the EU, and the impact the future trade arrangements the UK will have with the EU and the rest of the world is still unclear, posing a risk to the group.
Based on the headwinds faced by the group, we have given a "WATCH" recommendation at the current price of GBX 147 (as on 13 November 2019), while we look for any upcoming catalysts in the near term.
*Peers of the company are Morgan Advanced Materials PLC, Vitec Group Plc, Hill & Smith Holdings PLC, Avon Rubber PLC, Rotork PLC and Renishaw PLC
*All forecasted figures and peers have been taken from Thomson Reuters.
Disclaimer
PLEASE BE ADVISED THAT YOUR CONTINUED USE OF THIS SITE OR THE INFORMATION PROVIDED HEREIN SHALL INDICATE YOUR CONSENT AND AGREEMENT TO THESE TERMS.
References to ‘Kalkine’, ‘we’, ‘our’ and ‘us’ refer to Kalkine Limited.
This website is a service of Kalkine Limited. Kalkine Limited is a private limited company, incorporated in England and Wales with registration number 07903332.
The article has been prepared for informational purposes only and is not intended to be used as a complete source of information on any particular company. Kalkine is not responsible for material posted on this website and does not guarantee the content, accuracy, or use of the content in this site. No advice or information, whether oral or written, obtained by you from Kalkine or through or from the service shall create any warranty not expressly stated.
Kalkine do not offer financial advice based upon your personal financial situation or goals, and we shall NOT be held liable for any investment or trading losses you may incur by using the opinions expressed in our publications, market updates, news alerts and corporate profiles. Kalkine does not in any way endorse or recommend individuals, products or services that may be discussed on this site. You should discuss your portfolios and the risk tolerance level appropriate for your personal financial situation, with a professional licensed financial planner and adviser.

 CA
 NZ
 US
 AU
 IND

 UK
 Please wait processing your request...