TRX Gold Corporation
TRX Gold Corporation (NYSE: TRX) is a Canada-based gold company advancing the Buckreef Gold Project in Tanzania. The Company is engaged in the exploration, development and production of mineral property interests in the United Republic of Tanzania. The Buckreef Project's prospects include Buckreef, Bingwa, Tembo, Eastern Porphyry and Buziba.

Key Business & Financial Updates:
- Record Production and Revenue Growth: TRX Gold Corporation (TRX) delivered another record quarter in Q2 2026, with gold production rising to 7,453 ounces poured and 7,314 ounces sold, supported by higher grades and improved recovery rates at the Buckreef Gold project. Strong operational execution combined with a record average realized gold price of approximately USD 4,655/oz drove quarterly revenue to a record USD 34.1 million, significantly above prior-year levels.
- Exceptional Profitability and Cash Flow Expansion: The company generated substantial earnings leverage from rising gold prices and low-cost operations, reporting gross profit of USD 21.1 million with a strong 61% gross margin during Q2 2026. Adjusted EBITDA reached a record USD 20.2 million, while operating cash flow increased to USD 8.9 million, reflecting improved operational scale and efficient cost management. Cash costs also improved to approximately USD 1,506/oz, highlighting the operational strength of the Buckreef mine despite expanded mining activity.
- Expansion Projects and Processing Capacity Upgrade: TRX continues to advance its long-term growth strategy through significant processing plant expansion initiatives. Metallurgical test work demonstrated recovery rates of 89%–92%, supporting the decision to construct a larger 3,500+ tonne per day SAG/Ball mill processing plant, exceeding the original 3,000 tpd assumption in the prior PEA. In parallel, upgrades to the existing processing facility are underway and expected to enhance overall throughput capacity materially by late 2026.
- Mine Plan Optimization and Resource Expansion Potential: Management has initiated a revision of the Buckreef life-of-mine plan to reflect higher gold prices and expanded processing capacity. Preliminary analysis suggests potential for an enlarged third pit cutback, increased recoverable ounces, and extended open-pit operations before transitioning underground. Additionally, TRX is accelerating exploration activity, including drilling programs at Eastern Porphyry and multiple new exploration targets identified through extensive geophysical surveys, which may further strengthen long-term production growth potential.
- Strengthened Balance Sheet and Liquidity Position: The company significantly improved its financial position during Q2 2026, ending the quarter with approximately USD 26 million in cash, over USD 12 million in undrawn credit facilities, and minimal debt. Working capital improved materially to approximately USD 32.1 million, while ore stockpiles expanded to an estimated 20,147 contained ounces of gold, representing substantial embedded inventory value. This strengthened liquidity profile enhances TRX’s ability to fund expansion projects and operational growth internally.
Key Risks:
- Operational Expansion and Execution Risk: TRX Gold Corporation (TRX) faces execution risk related to its planned processing plant expansion and mine optimization projects, where delays, cost overruns, or operational disruptions could impact production growth and profitability.
- Gold Price and Commodity Volatility Risk: The company’s earnings and cash flow remain highly sensitive to fluctuations in gold prices, as recent record profitability has been significantly supported by elevated realized gold prices above historical assumptions used in prior economic studies.
- Cost Inflation and Mining Efficiency Risk: TRX remains exposed to rising mining and processing costs, including higher strip ratios, fuel, labor, and equipment expenses, which could pressure margins if operational efficiencies or recovery rates weaken.
Technical Observation (on the daily chart):
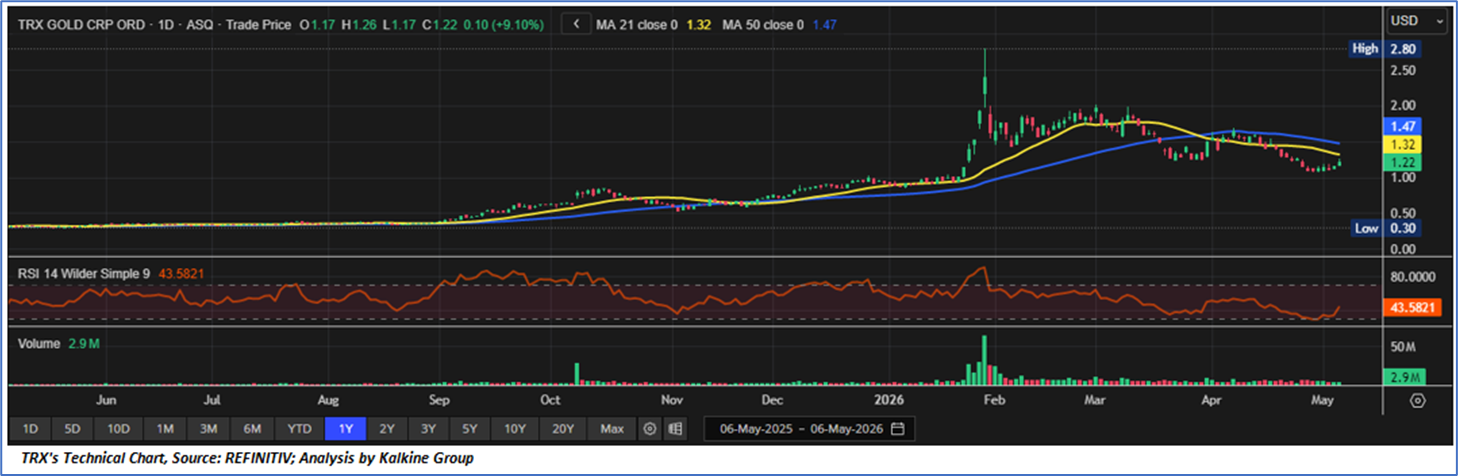
- Trend Structure and Moving Average Positioning: TRX Gold Corporation (TRX) is currently exhibiting a weak-to-neutral technical structure, with price trading below both the 21-day (~USD 1.32) and 50-day (~USD 1.47) moving averages, indicating lingering medium-term bearish pressure following the sharp correction from February highs. The downward slope of the moving averages suggests that momentum remains fragile despite recent stabilization near the USD 1.15–1.20 zone. However, the stock appears to be attempting a base formation after prolonged consolidation, which could signal early stages of trend stabilization if support levels continue to hold.
- Momentum Indicators and RSI Behaviour: Momentum indicators remain relatively subdued, with RSI hovering around the low-to-mid 40 range, reflecting weak but improving buying momentum after previously oversold conditions. The RSI recovery from lower levels suggests selling pressure may be moderating, although the indicator has not yet confirmed a strong bullish reversal. Importantly, the absence of overbought conditions leaves room for additional upside recovery should broader gold-sector sentiment strengthen. Sustained RSI movement above the 50 level would likely confirm improving momentum and stronger accumulation activity.
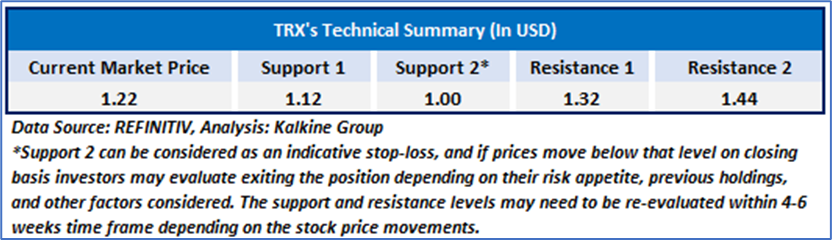
- Volume Trends and Key Technical Levels: Volume activity has moderated significantly following the earlier speculative surge, indicating reduced volatility and fading panic selling. Immediate resistance is observed near the USD 1.30–1.35 zone, aligned with the 21-day moving average, while stronger resistance lies near USD 1.45–1.50, corresponding to the 50-day moving average and prior breakdown region. On the downside, support appears near USD 1.10–1.15, where recent consolidation has emerged. A decisive breakout above the short-term resistance zone with improving volume could support a broader recovery toward prior trading ranges, whereas failure to hold support may extend the ongoing corrective trend.
TRX Gold Corporation (TRX) continues to strengthen its operational and financial profile through record gold production, rising realized gold prices, and strong profitability leverage from its low-cost Buckreef operation. The company generated record Q2 FY26 revenue of USD 34.1 million, gross profit margin of ~61%, and adjusted EBITDA of USD 20.2 million, while simultaneously advancing a major processing plant expansion expected to materially increase future production capacity. In addition, TRX’s improving liquidity position, minimal debt profile, expanding ore inventory, and ongoing mine-life optimization initiatives position the company to potentially benefit from sustained strength in gold prices and long-term production growth opportunities in Tanzania.

As per the above-mentioned price action, recent key business and financial updates, momentum in the stock over the last month, and technical indicators analysis, a ‘Speculative Buy’ rating has been TRX Gold Corporation (NYSE: TRX) at the current market price of USD 1.22 as of May 06, 2026, at 07:10 am PDT.
Individuals can evaluate the stock based on the support and resistance levels provided in the report in case of keen interest taking into consideration the risk-reward scenario.
Markets are trading in a highly volatile zone currently due to certain macro-economic issues and prevailing geopolitical tensions. Therefore, it is prudent to follow a cautious approach while investing.
Related Risk: This report may be looked at from a high-risk perspective and a recommendation is provided for a short duration. This report is solely based on technical parameters, and the fundamental performance of the stocks has not been considered in the decision-making process. Other factors which could impact the stock prices include market risks, regulatory risks, interest rates risks, currency risks, social and political instability risks etc.
Note 1: Past performance is not a reliable indicator of future performance.
Note 2: The reference date for all price data, currency, technical indicators, support, and resistance level is May 06, 2026. The reference data in this report has been partly sourced from REFINITIV.
Note 3: Investment decisions should be made depending on an individual's appetite for upside potential, risks, holding duration, and any previous holdings. An 'Exit' from the stock can be considered if the Target Price mentioned as per the Valuation and or the technical levels provided has been achieved and is subject to the factors discussed above.
Note 4: Target Price refers to a price level that the stock is expected to reach as per the relative valuation method and or technical analysis taking into consideration both short-term and long-term scenarios.
Note 5: ‘Kalkine reports are prepared based on the stock prices captured either from the New York Stock Exchange (NYSE), NASDAQ Capital Markets (NASDAQ), and or REFINITIV. Typically, all sources (NYSE, NASDAQ, or REFINITIV) may reflect stock prices with a delay which could be a lag of 15-20 minutes. There can be no assurance that future results or events will be consistent with the information provided in the report. The information is subject to change without any prior notice.

 CA
 NZ
 US
 AU
 IND

 UK

 Please wait processing your request...