
SIG Plc
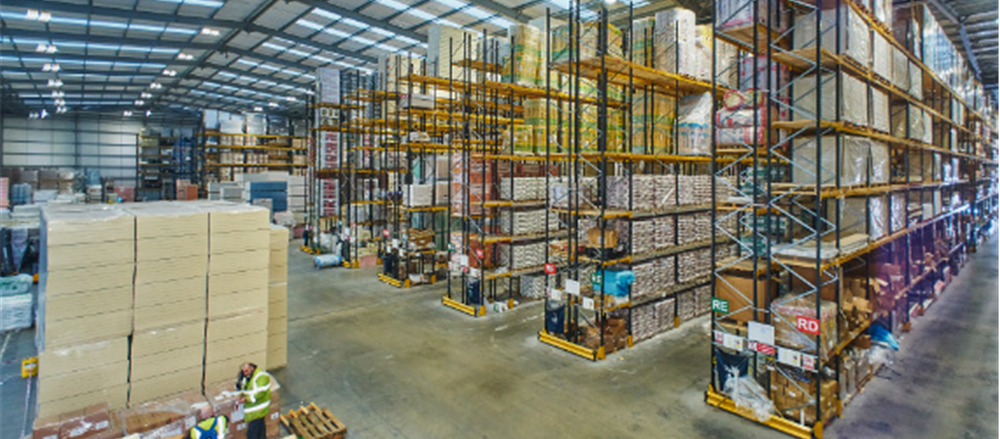
SIG PLC (SHI) is a Sheffield, the United Kingdom-based distributor of building products in Europe. The group is involved in the supply of expert products to construction and related markets. The company’s business is differentiated into two segments: UK & Ireland and Mainland Europe.
SIG Plc declined by over 19 per cent due to deterioration in construction activity in some key markets due to weaker macro-economic backdrop in Germany and the UK. The company also entered into an agreement for sale of its two businesses on 7th October 2019.
Recent News
On 7th October 2019, SIG announced the sale of Building Solutions Business to Kingspan Group for £37.5 million worth of consideration (debt-free and cash-free basis).
SIG announced the saleAir Handling Division to France Air (France Air Management SA) for £198.3 million (EUR 222.7 million) worth of consideration (debt-free and cash-free basis).
Trading Update
The company witnessed deterioration in construction activity in some key markets due to wear macro-economic backdrop in Germany and the UK. Benefiting from the transformational initiatives the company expects to deliver strong performance in the second half.
Financial Highlights – H1 Financial Year 2019 (30th June 2019, £, million)

(Source: Interim Report, Company Website)
In the first half of the financial year 2019, the company’s underlying revenue declined by 5.1 per cent to £1,260.1 million, while the company’s reported revenue declined to £1,272.6 million in H1 FY2019 versus £1,381.7 million in H1 FY2018. The decline in the revenue was driven by macro-economic uncertainty which impacted the revenue streams in Ireland & UK. The company’s reported operating profit stood at £17.8 million in H1 FY2019 as against £27.9 million in H1 FY2018. The company’s Adjusted operating profit stood at £36.5 million, an increase of 10.6 per cent from the previous year same period data. Adjusted profit before tax surged by 19.5 per cent to £30 million as compared to £25.1 million in H1 FY18. The company’s reported PBT (Profit before tax) stood at £5.2 million in H1 FY2019 as against £19.6 million in H1 FY2018. Adjusted earnings per share stood at 3.7 pence in H1 FY2019 against the 3 pence in H1 FY2018, an increase of 23.3 per cent for the period. The company’s basic earnings per share were at 0.2 pence in H1 FY2019 against the 2.5 pence in H1 FY2018. The company’s dividend per share remained flat at 1.25 pence for the period.
Share Price Performance

Daily Chart as at 7th October 2019, before the market closed (Source: Thomson Reuters)
On 7th October 2019, SIG Plc shares were trading at GBX 96.50 (at the time of writing before the market close, GMT 9:13 AM), and declined by 19.24 per cent against the previous day closing price. Stock's 52 weeks High and Low are GBX 154.00/GBX 87.60.
Valuation Methodology

Peers: Breedon Group Plc, Eurocell Plc, Travis Perkins Plc, Forterra Plc and Persimmon Plc.
Conclusion
The group currently facing a challenging economic environment and the continuing weak levels of market demand in the building and construction markets, including macro-economic uncertainty due to Brexit. Someadditional risks are the Delivery of the change agenda, Data quality, Market downturn, Supplier rebates, and Internal or external cyber-attacks could result in system disruption of loss of sensitive data.
The company (on an adjusted basis) had shown decent financial performance in the half-yearly results of the financial year 2019. The market environment in which company operates has low growth potential which can impact on company’s profitability. The company operates in multiple locations and any change in the economic and political policy can hamper the company’s operating performance.
Based on above valuation, we recommend investors to keep a "Watch" on the stock at the closing price of GBX 119.50 (as on 4th October 2019), with support from few catalysts needs to be evaluated at a later stage.
Northbridge Industrial Services Plc
Northbridge Industrial Services Plc (NBI) is an Industrial Engineering company providing industrial equipment to non-cyclical customer base. The company has been growing organically and through the acquisition of UK and abroad based companies. The company has a global customer base, and its offices are located in Korea, Brazil, New Zealand, Singapore, Australia, France, Germany, Belgium, Dubai, the United Kingdom and the United States.
Financial Highlights – H1 Financial Year 2019 (30th June 2019, £, thousand)

(Source: Interim Report, Company Website)
In the first half of the financial year 2019, the company’s revenue increased by 33 per cent to £16.8 million versus £12.6 million in H1 FY2018. The decline in the revenue was driven by macro-economic uncertainty which impacted the revenue streams in Ireland & UK. In H1 FY2019, the company’s gross profit was at £7,491 thousand versus £5,005 thousand in H1 FY2018, an increase of 50 per cent. The company’s EBITDA was up by 90 per cent to £3.4 million in H1 FY2019 from 1.8 million in H1 FY2018. The company’s reported operating profit stood at £401 thousand in H1 FY2019 as against an operating loss of £1,221 thousand in H1 FY2018. The company’s reported PBT (Profit before tax) stood at £22 thousand in H1 FY2019 as against an LBT (Loss before tax) of £1,509 thousand in H1 FY2018. The company’s reported LAT (Loss after tax) stood at £122 thousand in H1 FY2019 as against a LAT (Loss after tax) of £1,472 thousand in H1 FY2018. The company’s basic and diluted loss per share was at 0.4 pence in H1 FY2019 against basic and diluted loss per share of 5.7 pence in H1 FY2018.
Share Price Performance

Daily Chart as at 7th October 2019, before the market closed (Source: Thomson Reuters)
On 7th October 2019, Northbridge Industrial Services Plc shares were trading at GBX 127.50 (at the time of writing before the market close, GMT 11:20 AM), and remained same against the previous day closing price. Stock's 52 weeks High and Low are GBX 185.00/GBX 107.50.
Conclusion
Although the top-line and the profitability have improved in the first half of the financial year 2019,the bottom-line of the company remained in the negative zone for the current period. The business operations of the company might be impacted due to the challenging economic environment and macro-economic uncertainty due to Brexit.
As the company operates in multiple geographies, any change in the governmental regulations may negatively impact the company’s operational performance, and exchange rate fluctuations can negatively impact the company’s financial performance as well.
Based on the above valuation, we recommend investors to keep a "Watch" on the stock at the current price of GBX 127.50 (as on 7th October 2019, before the market close), with support from few catalysts needs to be evaluated at a later stage.
*All forecasted data and peers have been taken from Thomson Reuters.
Disclaimer
PLEASE BE ADVISED THAT YOUR CONTINUED USE OF THIS SITE OR THE INFORMATION PROVIDED HEREIN SHALL INDICATE YOUR CONSENT AND AGREEMENT TO THESE TERMS.
References to ‘Kalkine’, ‘we’, ‘our’ and ‘us’ refer to Kalkine Limited.
This website is a service of Kalkine Limited. Kalkine Limited is a private limited company, incorporated in England and Wales with registration number 07903332.
The article has been prepared for informational purposes only and is not intended to be used as a complete source of information on any particular company. Kalkine is not responsible for material posted on this website and does not guarantee the content, accuracy, or use of the content in this site. No advice or information, whether oral or written, obtained by you from Kalkine or through or from the service shall create any warranty not expressly stated.
Kalkine do not offer financial advice based upon your personal financial situation or goals, and we shall NOT be held liable for any investment or trading losses you may incur by using the opinions expressed in our publications, market updates, news alerts and corporate profiles. Kalkine does not in any way endorse or recommend individuals, products or services that may be discussed on this site. You should discuss your portfolios and the risk tolerance level appropriate for your personal financial situation, with a professional licensed financial planner and adviser.

 CA
 NZ
 US
 AU
 IND

 UK
 Please wait processing your request...