
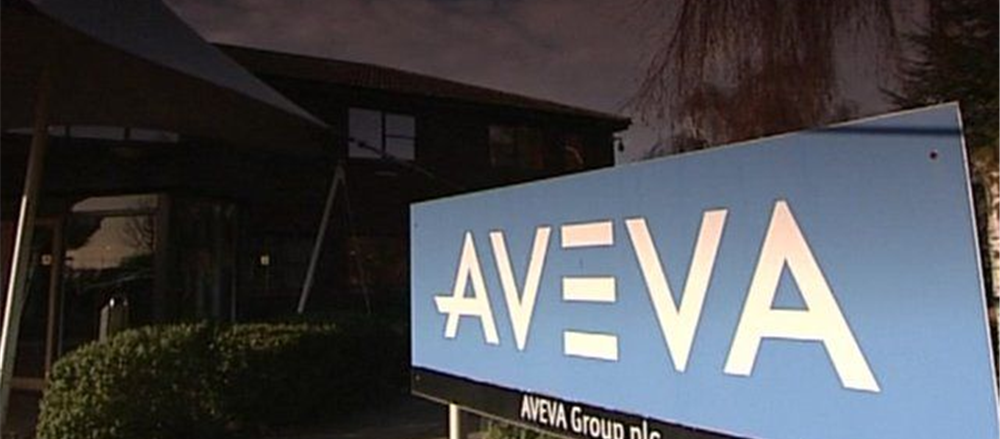
AVEVA Group Plc
The software and computer service provider AVEVA Group Plc (AVV) was incorporated in 1967 and is headquartered in Cambridge, United Kingdom. Company is engaged in providing engineering, design and information management software with geographical presence in the Asia Pacific, Americas and Europe and EMEA.
Q1 FY2020 Trading Update (as on 25th July 2019)
On a constant currency basis, the company had made a decent start to the fiscal year 2020, recording high single-digit growth in revenue for the first quarter of the financial year 2020. The company recorded low double-digit growth in the revenue, with the benefit of a foreign exchange translation tailwind. In Q1 FY2020, subscription and rental revenue increased and backed by the start of AVEVA Flex, the subscription providing for Control and Monitoring. From a geographical viewpoint, each of the areas increased as compared with the corresponding period of the last year, with Asia Pacific region showed significant growth. In Q1 FY20, the group’s each of the business units rose, with mainly robust progress in Engineering. The company maintains a solid balance sheet. On 30th June 2019, the company also had net cash and treasury deposits of £114.6 million.
Financial Highlights (FY2019, £ million)

(Source: Final Results, Company Website)
On a pro forma basis, revenue for the combined Group surged by 11.9 per cent to £775.2 million as compared with the financial year 2018 data of £692.5 million, while statutory revenue increased by 57.6 per cent to £766.6 million. Adjusted EBIT on pro forma basis rose by 19.8 per cent to £184.5 million against £154 million in 2018, driven by the revenue growth, increase in gross margin and operational leverage. On a statutory basis, profit before tax climbed by 35.4 per cent to £46.7 million as compared to £34.5 million in FY18. On a pro forma basis, adjusted diluted basis earnings per share were up by 27.0 per cent to 90.90 pence as compared with the financial year 2018 of 71.59 pence. Statutory diluted earnings per share stood at 20.90 pence, a decrease of 47.4 per cent against the 39.72 pence in 2018, due to a greater number of shares issued on an average as a result of the combination. Final dividend per share rose by 7.4 per cent to 29 pence as compared to 27 pence in FY18.
Share Price Performance

Daily Chart as at 26th July 2019, before the market closed (Source: Thomson Reuters)
On 26th July 2019, at the time of writing (before the market close, GMT 12:03 PM), AVEVA Group PLC shares were hovering at GBX 4,030 and increased by 1.716 per cent as compared with the previous day closing price. Stock's 52 weeks High is GBX 4,232 and 52-weeks Low is GBX 2,264. The company’s stock beta stood at 1.63, reflecting higher volatility against the benchmark index.
Valuation Methodology

Key Risks
Talent Acquisition & Retention Move to Subscription Model, Cloud Initiatives, Digital Transformation Agenda, Integration & Synergies, Competitors, Dependency on Cyclical Markets, Cyber Attack, Internal IT Systems, and Disruptive Technologies.
Conclusion
The reported revenue growth was at low double-digit in the first quarter. The current results show growth in all geographies and product groups. Heritage AVEVA grew by 14% and Heritage Schneider grew by 11%. The integration process continues to look very smooth, with over half of planned cost savings implemented, continued progress in property rationalisation, progress towards common group-wide IT systems, and the exit of most Transitional Service Agreements.
Unfavourable changes in the foreign currency exchange ratesare likely to increase the expenses of the company. The company’s success depends on its ability to provide high quality and reliable products and services. The company's products and services are characterized by rapid technological changes, which may affect its business operations.
Based on the above rationale and supported by valuation done using the above method, we have given a "WATCH" recommendation at the closing price of GBX 3,962 (as on 25th July 2019), with support from few catalysts needs to be evaluated at a later stage.
Fuller Smith & Turner PLC
Fuller Smith & Turner PLC is a British pure-play pub and hotel operator, headquartered in South London, United Kingdom. The company's operations are differentiated in three operating segments: Managed Pubs and Hotels, The Fuller's Beer Company, and Tenanted Inns. The company operates own-operated pubs and hotels, as well as manages pubs operated by third parties under tenancy or lease agreements.
Financial Highlights (FY2019, £million)

(Source: Final Results, Company Website)
In FY2019, the company’s reported revenue increased by 7 per cent to £431.1 million as compared with the financial year 2018 of £403.6 million, due to strong like for like (LFL) trading within the Managed estate and the contribution from the ten acquisitions and one new opening made in the early part of the current year. Revenue from Managed pubs and hotels segment increased by 8 per cent to £293.8 million, tenanted Inns surged by 2 per cent and the fuller’s beer company rose by 6 per cent.
EBITDA increased by 3 per cent to £73.2 millionagainst the £70.9 million in FY18, while proforma net debt to EBITDA ration surged to 3.1 times. Adjusted group profit stood at £43.2 millionand remained flat as compared with the previous year data. Adjusted earnings per share stood at 62.78 pence against the 62.90 pence in FY18.
Basic earnings per share declined by 46 per cent to 35.12 penceas compared with the financial year 2018 of 64.89 pence. Statutory Profit before tax stood at £26.1 million, a decrease of 40 per cent against the £43.6 million in FY18. The total profit of the year declined to £19.5 millionas compared to £34.8 million in FY18. Overall net debt surged by £43.3 million to £245.2 millionagainst the prior year data, due to the capital investment and acquisitions made during the year. Net debt on 29th June 2019 stood at £21.7 million. Total dividend per share was 20.15 pence, an increase of 3 per cent against the 19.55 pence in FY18.
Share Price Performance

Daily Chart as at 26th July 2019, before the market closed (Source: Thomson Reuters)
On 26th July 2019, at the time of writing (before the market close, GMT 10:34 AM), Fuller Smith & Turner PLC shares were hovering at GBX 1,090 and increased by 0.693 per cent as compared with the previous day closing price. Stock's 52 weeks High is GBX 1,210 and 52-weeks Low is GBX 846. The company’s stock beta stood at 0.60, reflecting lower volatility against the benchmark index.
Valuation Methodology

Conclusion
In the first 16 weeks of the financial year 2020, Managed Pubs and Hotels segment LfL sales surged by 1.2 per cent and total sales rose by 2.3 per cent. Tenanted Inns LfL profits decreased by 3 per cent for the first 16 weeks. On 27th April 2019, sale of the Fuller’s Beer segment completed of around £250 million.
There is also an increased risk of staffing shortages, which will lead to recruitment getting more competitive. This might drive wage inflation, especially if the free movement is restricted after Brexit. Market uncertainty is affecting the consumer sentiment, which can adversely impact discretional demand as well. Higher input costs can reduce the profitability margins.
The company recently sold its beer business, which will help it to focus on its core business now.A new online B2B sales are slated to be started which would help the group to optimise and drive business. As the company has no operations in Europe, it is well insulated against any direct impact of Brexit. However, the company operates in a highly regulated and competitive environment, and any new legislation impacts the operations of the group.
Based on the above rationale and supported by valuation done using the above method, we have given a "WATCH" recommendation at the closing price of GBX 1,082.50 (as on 25th July 2019), with support from few catalysts needs to be evaluated at a later stage.
*All forecasted figures and peers have been taken from Thomson Reuters.
Disclaimer
PLEASE BE ADVISED THAT YOUR CONTINUED USE OF THIS SITE OR THE INFORMATION PROVIDED HEREIN SHALL INDICATE YOUR CONSENT AND AGREEMENT TO THESE TERMS.
References to ‘Kalkine’, ‘we’, ‘our’ and ‘us’ refer to Kalkine Limited.
This website is a service of Kalkine Limited. Kalkine Limited is a private limited company, incorporated in England and Wales with registration number 07903332.
The article has been prepared for informational purposes only and is not intended to be used as a complete source of information on any particular company. Kalkine is not responsible for material posted on this website and does not guarantee the content, accuracy, or use of the content in this site. No advice or information, whether oral or written, obtained by you from Kalkine or through or from the service shall create any warranty not expressly stated.
Kalkine do not offer financial advice based upon your personal financial situation or goals, and we shall NOT be held liable for any investment or trading losses you may incur by using the opinions expressed in our publications, market updates, news alerts and corporate profiles. Kalkine does not in any way endorse or recommend individuals, products or services that may be discussed on this site. You should discuss your portfolios and the risk tolerance level appropriate for your personal financial situation, with a professional licensed financial planner and adviser.

 CA
 NZ
 US
 AU
 IND

 UK
 Please wait processing your request...