.png)
Overview
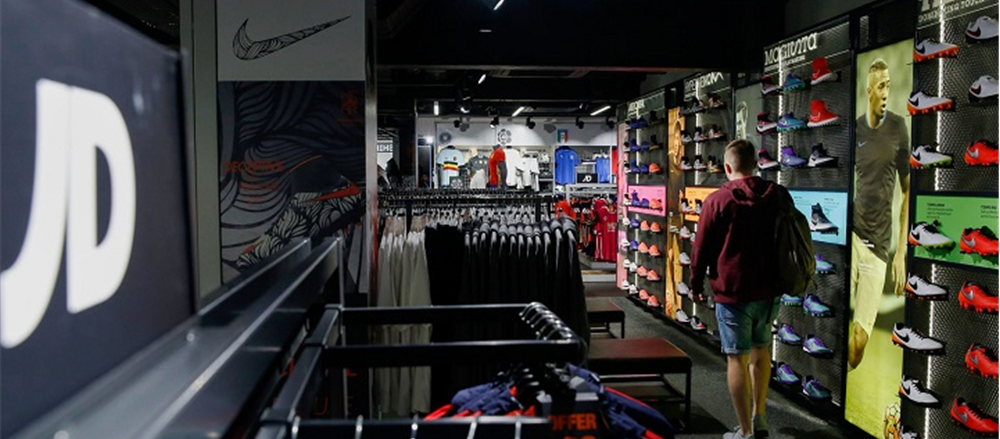
JD Sports Fashion PLC (JD) is a General Retailers company selling branded leisurewear. The company, through its chain of retail stores, operates in two segments being Sports Fashion and Outdoor. The sports fashion business includes brands like Kooga, Cloggs, Tessuti, Sprinter, Source Lab, JD Gyms, Kukri Sports, Getthelabel.com, Nicholas Deakins, Scotts and Chausport. The outdoor business includes a portfolio of brands such as Ultimate Outdoors, Millets, Blacks and Tiso.
JD Sports Fashion Plc stock has surged by over 7 per cent due to decent interim results posted for the first half of the financial year 2020.
Recent News
On 10th September 2019,JD Sports Fashion announced its interim results ending August 3rd, 2019.
Financial Highlights – H1 Financial Year 2020 (£, million)
.png)
(Source: Interim Report, Company Website)
For the first half of the financial year 2020, the company’s revenue surged by 47 per cent in H1 FY2020 to £2,721.20 millionas against £1,846.30 million in the H1 FY2019. The increase in the revenue was driven by an increase in global Sports Fashion fascias in the UK and Ireland markets. The company’s operating profit (before exceptional) increased to £199.8 millionin H1 FY2020 from £123.9 million in the H1 FY2019. The PBT (Profit before Tax and exceptional) surged to £158.6 million in H1 FY2020from £121.9 million in the H1 FY2019. The PBT (Profit before Tax) surged to £129.9 million in H1 FY2020from £121.9 million in the H1 FY2019. The company’s profit for the period stood at £98 million in H1 FY2020versus a profit for the period of £95.4 millionin the H1 FY2019. The company’s basic and diluted earnings per share stood at 9.67 pence in H1 FY2020 versus basic and diluted earnings per share of 10.05 pence in H1 FY2019. The company’s adjusted earnings per share stood at 12.57 pence in H1 FY2020 versus adjusted earnings per share of 10.05 pence in H1 FY2019. The company’s interim dividend for H1 FY2020 was at 0.28 pence versus 0.27 pence in H1 FY2019.
Share Price Performance
.png)
Daily Chart as at 10th September 19, before the market close (Source: Thomson Reuters)
On 10th September 2019, JD Sports Fashion Plc shares were trading at GBX 679.60 at the time of writing before the market close (at 2:35 PM GMT), up by 7.43 per cent against the previous day closing price. Stock's 52 weeks High and Low are GBX 689/GBX 318.50. The group’s stock is reflecting lower volatility as against the benchmark index based on the company’s beta of 0.76.
Valuation Methodology
.png)
Conclusion
The company had shown decent financial performance for the first half of the financial year 2020. The company’s top-line and the bottom-line performance for the period have improved resulting fromanincrease in global Sports Fashion fascias in the UK and Ireland markets. The company’s operation would be impacted by the uncertainty created due to ongoing Brexit as it negatively impacts the company’s supply chain. The company has a huge reliance on non-UK manufactured products and have to pay extra money as an exchange cost to procure such products.
On the basis of the above rationale and valuation methodology, we recommend investors to keep a “Watch” on the stock at the closing price of GBX 632.60 (as on 9th September 2019), while we look for any upcoming catalysts.
*All forecasted figures and peers have been taken from Thomson Reuters.
Disclaimer
PLEASE BE ADVISED THAT YOUR CONTINUED USE OF THIS SITE OR THE INFORMATION PROVIDED HEREIN SHALL INDICATE YOUR CONSENT AND AGREEMENT TO THESE TERMS.
References to ‘Kalkine’, ‘we’, ‘our’ and ‘us’ refer to Kalkine Limited.
This website is a service of Kalkine Limited. Kalkine Limited is a private limited company, incorporated in England and Wales with registration number 07903332.
The article has been prepared for informational purposes only and is not intended to be used as a complete source of information on any particular company. Kalkine is not responsible for material posted on this website and does not guarantee the content, accuracy, or use of the content in this site. No advice or information, whether oral or written, obtained by you from Kalkine or through or from the service shall create any warranty not expressly stated.
Kalkine do not offer financial advice based upon your personal financial situation or goals, and we shall NOT be held liable for any investment or trading losses you may incur by using the opinions expressed in our publications, market updates, news alerts and corporate profiles. Kalkine does not in any way endorse or recommend individuals, products or services that may be discussed on this site. You should discuss your portfolios and the risk tolerance level appropriate for your personal financial situation, with a professional licensed financial planner and adviser.

 CA
 NZ
 US
 AU
 IND

 UK
 Please wait processing your request...