
Index Update: The FTSE 100 index, a key benchmark index for the London stock exchange, was trading declined around 0.09% on 31 December 2025.
Macro Update: As of late 2025, the UK economy faces stagnant growth, with GDP contracting 0.1% between August and October. Despite sticky inflation at 3.2%, the Bank of England cut interest rates to 3.75% in December to support a weakening labour market.
Top Market Movers: Among top gainers on FTSE 100 index, Vodafone Group PLC (LSE: VOD) witnessed a rise of 0.73% followed by Rentokil Initial PLC (LSE: RTO) which gained around 0.45%.
Commodity Update: Major currencies traded in narrow ranges on Wednesday amid thin year-end volumes, as investors awaited Federal Reserve meeting minutes for policy cues into 2026. Regional FX activity stayed muted. Gold fell 0.49% to USD 4,364.65, silver dropped 5.26% to USD 73.82, and copper eased 0.68% to USD 12,549.00. Brent crude slipped 0.20% to USD 61.23, with oil down over 10% in 2025 amid supply-demand imbalances.
Our Stance: Our stance is that the UK economy is navigating a challenging period of low growth and persistent inflation. The Bank of England's rate cuts aim to stimulate activity amidst a weakening job market, but significant fiscal pressures remain.
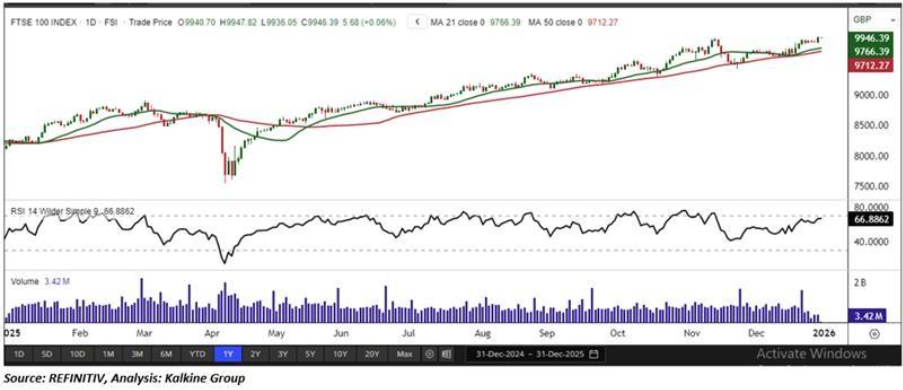
FTSE 100: In its latest session, the FTSE 100 Index gained 5.68 points to close at 9,946.39, forming a small bullish candlestick. The broader technical outlook remains constructive. On the daily chart, the index continues to trade above its 50-period Simple Moving Average (SMA), which serves as a key dynamic support and reinforces the prevailing short-term bullish trend. A notable support zone is positioned near 9,860, and maintaining price action above this level will be critical for sustaining the ongoing uptrend. On the upside, a decisive breakout above immediate resistance levels would provide strong bullish confirmation, potentially triggering fresh upward momentum and further improving investor sentiment. From a broader perspective, the index also remains above its 21-period SMA on the weekly chart, underscoring the resilience of its longer-term bullish structure despite recent short-term fluctuations.
Source - EODHD/Others


 Please wait processing your request...