
Index Update: The FTSE 100 index, a key benchmark index for the London stock exchange, was trading declined around 0.74% on 11 March 2026.
Macro Update: The UK economy is currently defined by stagnant growth and a "wait-and-see" approach from the Bank of England regarding interest rates. While inflation has eased, a cooling labour market and high mortgage costs continue to squeeze households. Resilience in manufacturing offers some optimism, but global geopolitical tensions remain a significant risk.
Top Market Movers: Among top gainers on FTSE 100 index, Pershing Square Holdings PLC (LSE: PSH) witnessed a rise of 1.84% followed by Hikma Pharmaceutical PLC (LSE: HIK) which gained around 1.50%.
Commodity Update: The U.S. dollar remained steady on Wednesday as investors stayed cautious, waiting for clearer developments in the ongoing U.S.–Israel conflict with Iran. Uncertainty around a potential resolution kept overall market sentiment fragile. In commodities, gold slipped 0.40% to USD 5,221.40, silver declined 0.88% to USD 88.78, and copper eased 0.31% to USD 13,129. Meanwhile, Brent crude edged up 0.13% to USD 87.91 after reports that the IEA may release record oil reserves to ease supply concerns.
Our Stance: The UK remains in a low-growth trap, balanced between cooling inflation and a softening labor market. High borrowing costs continue to strain households, while service sector resilience barely offsets construction declines. Overall, the stance is one of cautious stabilization amid persistent geopolitical risks and high interest rates.
FTSE 100: The FTSE 100 Index is trading around 10,305.93 on March 11, 2026, down 106.31 points (1.02%) during the session, reflecting mild selling pressure. Technically, the index remains below its 20-day moving average near 10,565.30, indicating weak short-term momentum, while it is hovering close to the 50-day moving average around 10,341.59, which may act as a key reference level. The RSI is near 43.52, suggesting slightly weak momentum. On the downside, 9,900–10,100 may act as support, while 10,600–10,900 could act as resistance.
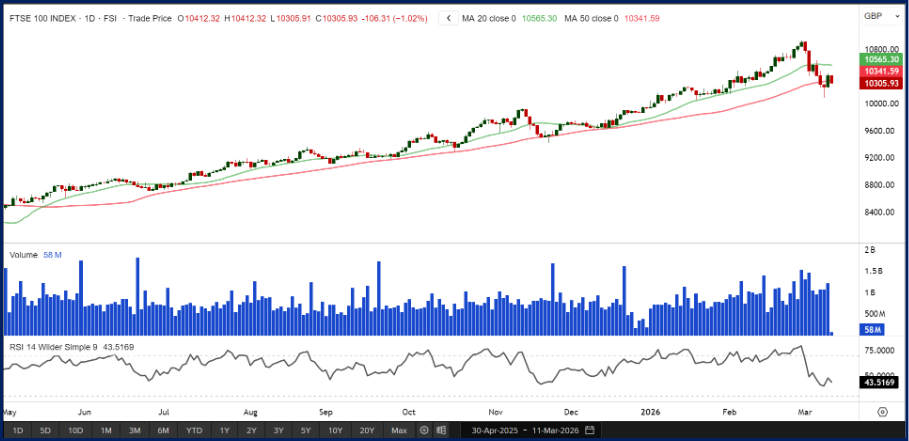
Source: Charts by EODHD/Others


 Please wait processing your request...