
Index Update: The FTSE 100 index, a key benchmark index for the London stock exchange, was trading decline around 2.91% on 19 March 2026.
Macro Update: The UK economy is currently defined by stagnant growth and renewed inflation (projected at 3.5%) following global energy shocks. While services remain resilient, manufacturing and retail face pressure from high interest rates (3.75%) and rising labor costs. Unemployment has climbed to 5.2%, leaving the Bank of England in a cautious "wait-and-see" mode.
Top Market Movers: Among top gainers on FTSE 100 index, BP PLC (LSE: BP.) witnessed a rise of 2.54% .
Commodity Update: The U.S. dollar held steady after the Federal Reserve kept rates unchanged, highlighting uncertainty from rising oil prices. Fed Chair Jerome Powell said higher energy costs will likely push inflation higher. Gold fell 0.70% to USD 4,862.50, silver dropped 1.34% to USD 76.54, and copper declined 1.12% to USD 12,275.00. Meanwhile, Brent crude surged 4.52% to USD 112.26 after Iran struck key energy facilities following the South Pars attack, escalating Middle East tensions and supply risks.
Our Stance: The UK maintains a cautious fiscal stance, prioritizing debt reduction and inflation control over aggressive stimulus. The government is balancing high tax-to-GDP ratios (projected at 38%) with targeted investments in renewables and manufacturing to bolster long-term resilience against global energy shocks and a softening labor market.
FTSE 100: The FTSE 100 Index is currently trading near 10,129.11, declining 176.18 points (-1.71%) in the session. Technically, the index remains below both its 20-day moving average at 10,494.20 and 50-day moving average at 10,374.94, indicating a weak short-term structure. The recent price action reflects a pullback after a prior upward trend, with prices moving lower in the near term. Momentum indicators are subdued, with the RSI near 38.27, suggesting easing momentum. On the downside, 10,000–9,800 may act as a support zone, while 10,350–10,500 could act as a resistance band influencing the index’s direction.
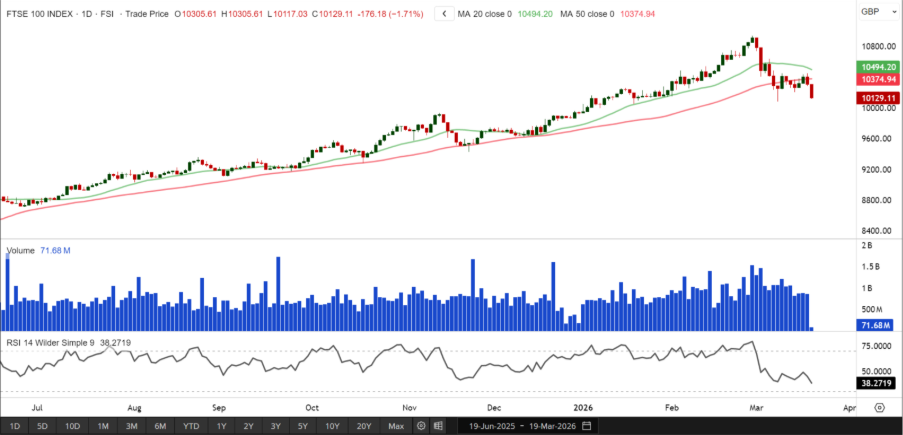
Source: Charts by EODHD/Others


 Please wait processing your request...