
Index Update: The FTSE 100 index, a key benchmark index for the London stock exchange, was trading down around 0.14% on 04 December 2025.
Macro Update: The UK economy has experienced sluggish growth, including a 0.1% contraction in September. While inflation is falling, it remains above the Bank of England's 2% target, continuing to fuel cost-of-living concerns.
Top Market Movers: Among top gainers on FTSE 100 index, Burberry Group PLC (LSE: BRBY) witnessed a rise of 3.02% followed by Ashtead Group PLC (LSE: AHT) which gained around 2.60%.
Commodity Update: The U.S. dollar weakened after soft data reinforced expectations of a Fed rate cut next week, lifting the yen and pushing the euro to a nearly seven-week high. Gold down 0.23% to USD 4,222.70, silver gained 0.17% to USD 58.735, and copper inched up 0.06% to USD 11,487.00. Brent crude up 0.43% to USD 62.94 as geopolitical risks from Ukrainian strikes on Russian oil sites supported prices, though fragile fundamentals capped upside.
Our Stance: OFGEM has approved a £28 billion energy grid upgrade, which could support growth but raises concerns about consumer bills. Meanwhile, persistent issues related to Brexit continue to impact the UK's economic performance compared to other developed economies.
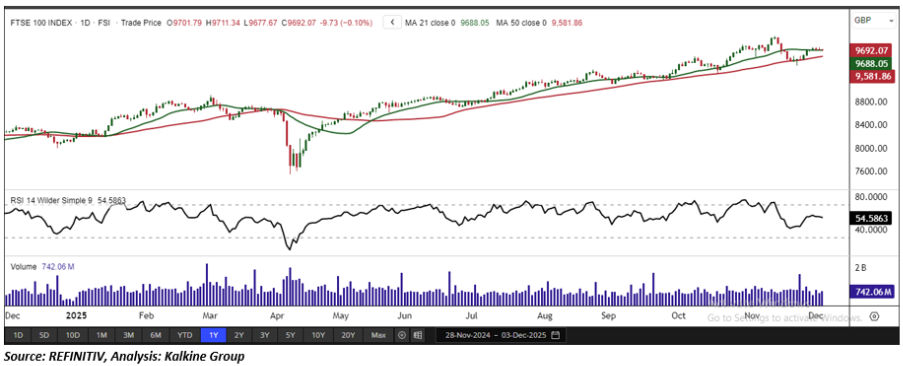
FTSE 100
The FTSE 100 Index declined 9.73 points to close at 9,692.07, forming a small bearish candlestick. Despite this minor pullback, the broader technical outlook remains constructive. On the daily chart, the index continues to trade above its 50-period Simple Moving Average (SMA), which serves as a key dynamic support and reinforces the prevailing short-term bullish trend. A notable support zone is positioned near 9,580.50, and maintaining price action above this level will be critical for sustaining the ongoing uptrend. On the upside, a decisive breakout above immediate resistance levels would provide strong bullish confirmation, potentially trigger fresh upward momentum and further improving investor sentiment. From a broader perspective, the index also remains above its 21-period SMA on the weekly chart, underscoring the resilience of its longer-term bullish structure despite recent short-term fluctuations.
Source - EODHD/Others


 Please wait processing your request...