
Image Source : Krish Capital Pty Ltd
Index Update: The FTSE 100 index, a key benchmark index for the London stock exchange, went up around 0.11% on 21 January 2025. HealthCare, Consumer Cyclicals & Financials sector has witnessed a substantial growth. Moreover, Real Estate, Basic Materials & Energy sector has faced a major decline.
Macro Update: British finance minister Rachel Reeves will use her trip to Davos to call on businesses to increase investment in the UK, seeking to address the country's sluggish economic growth, which has contributed to recent market volatility. Reeves, along with Prime Minister Keir Starmer, faces significant economic challenges, including backlash from a £25 billion payroll tax hike aimed at funding infrastructure and public services. This move has provoked employer criticism and raised borrowing costs, which may force the government to either cut already stretched spending or introduce additional tax increases, further straining growth prospects. Meanwhile, private-sector pay growth excluding bonuses rose to 6.0% in the three months to November, up from 5.5% in October, exceeding Bank of England forecasts and keeping inflationary pressures high despite early signs of a softening jobs market. In the energy sector, Serica Energy anticipates a 15.6% rise in production for 2025, supported by investments and improved asset reliability after overcoming outages in its North Sea operations in 2024.
Top Market Movers: Among top gainers on FTSE 100 index, Lloyds Banking Group PLC (LSE: LLOY) witnessed a rise of 3.99% followed by Airtel Africa PLC (LSE: AAF) which gained around 1.78%.
Commodity Update: The U.S. dollar rebounded in volatile Asian trading on Tuesday after President Donald Trump hinted at potential tariffs on Canada and Mexico, though specifics were unclear. In commodities, gold rose by 0.30% to $2,740.00, silver gained 0.69% to $31.36, and copper saw a slight dip of 0.02% to $9,266.00. Brent crude dropped 0.10% to $80.60 per barrel following Trump’s declaration of a national emergency to bolster U.S. energy production. However, crude losses were limited by dollar weakness and expectations of new U.S. sanctions on Venezuela, which could further tighten the global oil supply.
Our Stance: Global financial markets displayed significant volatility at the start of Donald Trump’s second U.S. presidency, reflecting heightened sensitivity to his policy announcements. Initial relief followed his inauguration speech, which avoided direct mention of immediate tariffs, particularly against China, leading to a brief rally in Chinese stocks, the yuan, and global equities. Investors were cautiously optimistic, interpreting the softer tone as a potential signal for improved U.S.-Sino relations. However, this optimism was short-lived as Trump, within hours, hinted at the possibility of 25% tariffs on Mexico and Canada starting February 1, which sent shockwaves through the markets. European futures indicated a lower open, underscoring global apprehension about his trade agenda and the potential for economic disruption. The contrasting signals from Trump’s initial actions and rhetoric highlight the uncertainty surrounding his presidency, leaving markets highly reactive and emphasizing the fragility of investor confidence amidst unpredictable policy shifts.
FTSE 100
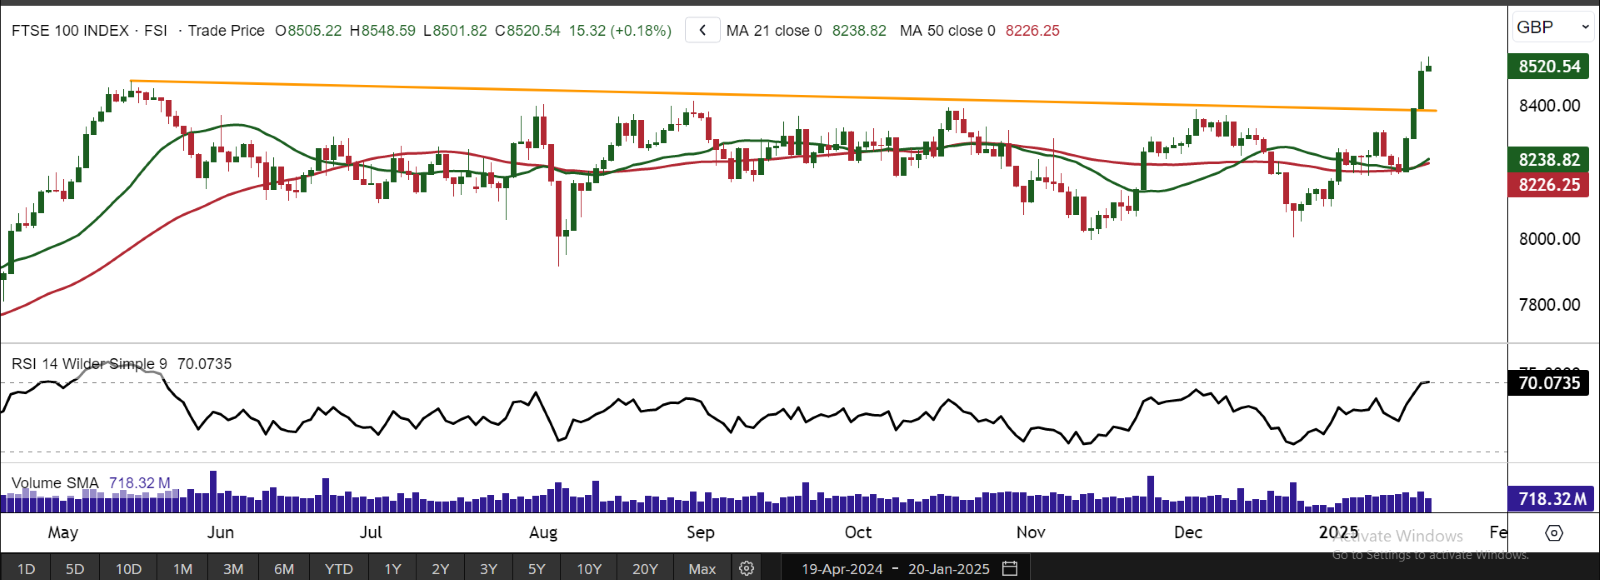
The FTSE 100 closed at 8,520.54 on Monday, up 0.18%, forming a bullish candlestick pattern and breaking through its strong resistance level, closing above it. The index remains above its 21-period Simple Moving Average (SMA), signaling potential short-term upward momentum. The 50-period SMA adds further support, increasing the likelihood of continued gains. The Relative Strength Index (RSI) stands at 70.07, reflecting sustained bullish sentiment. These technical indicators suggest that the FTSE 100 could continue its upward trajectory if support levels hold and it stays above key moving averages, reinforcing the positive outlook for the near term. On the weekly chart, the FTSE 100 rose 3.11%, closing at 8,505.22, above the 50-period SMA at 8,148.56. Key support is at 7,932, with resistance at 8,400. Breaking the 8,400 resistance signals stronger bullish momentum, potentially targeting the next resistance at 8,700. A drop below 8,020 could signal further downside. Monitoring these levels will be crucial for predicting future price movements.
Data Source - EODHD/Others


 Please wait processing your request...