
Image Source : Krish Capital Pty Ltd
Index Update: The FTSE 100 index, a key benchmark index for the London stock exchange, went up around 0.65% on 09 January 2025. Real Estate sector has witnessed a substantial decline. Moreover, Basic Materials, HealthCare and Energy sector has faced a significant growth.
Macro Update: British businesses anticipate price hikes and workforce reductions due to increased social security contributions taking effect in April, with 61% expecting profit declines, 54% planning price increases, and 53% forecasting reduced employment, according to a Bank of England survey. Meanwhile, Finance Minister Rachel Reeves faces challenges as UK borrowing costs hit a 26-year high, exacerbating pressure on public finances. Retail stocks, including Marks & Spencer, fell sharply, erasing £2 billion in value, as concerns over weak consumer confidence and rising costs overshadowed positive holiday sales. Additionally, the pound fell to its lowest level since late 2023, reflecting global bond market volatility driven by inflation fears, potential U.S. policy shifts under President-elect Trump, and mounting debt concerns.
Top Market Movers: Among top gainers on FTSE 100 index, Antofagasta PLC (LSE: ANTO) witnessed a rise of 4.90% followed by Anglo American PLC (LSE: AAL) which gained around 4.33%.
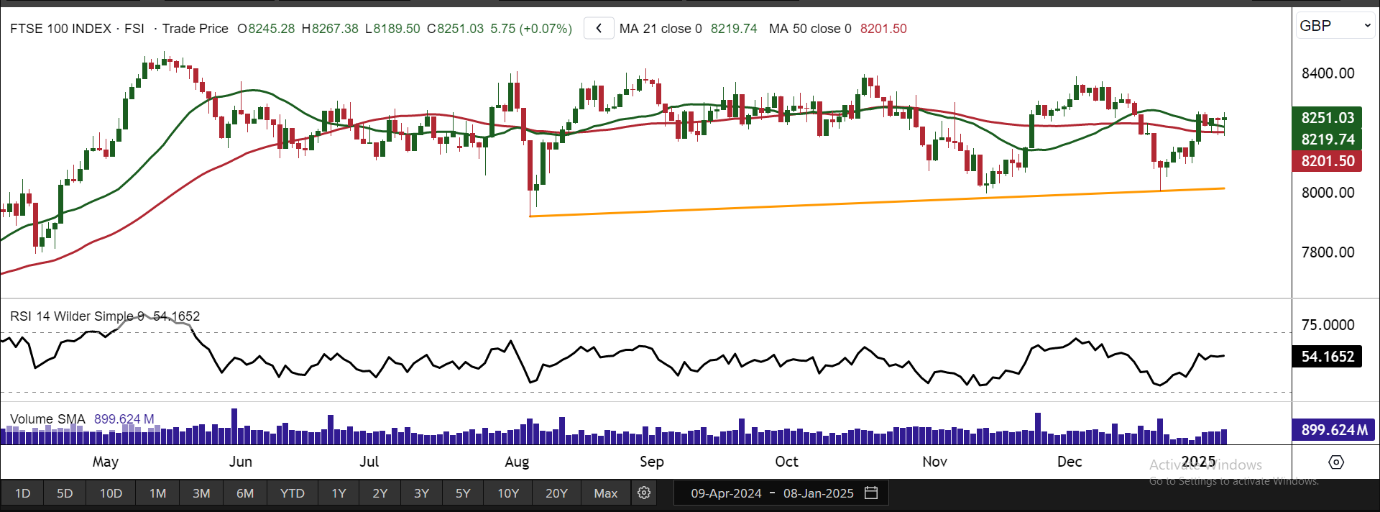
Commodity Update: The FTSE 100 closed at 8,251.03 on Wednesday, posting a modest 0.07% gain and forming a bullish candlestick pattern, with strong support at 8,002.00. The index remains above its 21-period Simple Moving Average (SMA), suggesting potential short-term upward momentum. The 50-period SMA provides additional downside support, limiting the risk of a sharp decline. With the Relative Strength Index (RSI) at 54.16, the index is recovering from oversold conditions, signaling mildly bullish sentiment. These technical indicators suggest a positive near-term outlook for the FTSE 100. On the weekly chart, the FTSE 100 rose 0.74%, staying above the 50-period SMA at 8,118.50. Key support is at 7,932, while resistance is at 8,400. A breakout above this level could lead to a stronger bullish trend, while a fall below 8,020 may point to further downside. Monitoring these levels will be crucial for investors to gauge future price movements.
Our Stance: The Federal Reserve's December meeting revealed heightened concerns about inflation due to President-elect Donald Trump's proposed policies on aggressive tariffs and immigration reform. Officials noted these plans could slow economic growth and raise unemployment, potentially prolonging the fight against inflation. Analysts, including Allianz's Charlie Ripley, highlighted inflation as a key risk for 2025, with the potential to disrupt the current trajectory of price stability. The Fed minutes underscored policymakers' struggles with balancing inflationary pressures amid anticipated policy shifts from the incoming administration. Trump's proposed policies could introduce significant economic volatility, with potential upward pressure on inflation and challenges to employment. The Fed's cautious approach reflects the uncertain impact of these policy changes on long-term economic growth. Markets may remain jittery as they await clarity on the administration's direction..
FTSE 100
The FTSE 100 closed at 8,245.28 on Tuesday, registering a slight 0.05% loss and forming a bearish candlestick pattern, with strong support at 8,002.00. Despite this, the index remains above its 21-period Simple Moving Average (SMA), signaling potential short-term upward momentum. The 50-period SMA offers additional downside protection, suggesting limited risk. The Relative Strength Index (RSI) of 53.57 indicates a recovery from oversold conditions, reflecting a mildly bullish sentiment. These technical factors point to a positive short-term outlook for the index. On the weekly chart, the FTSE 100 gained 0.74%, holding above the 50-period SMA at 8,118.50. Support is at 7,932, while resistance stands at 8,400. A breakout above this level could trigger a more bullish trend, while a drop below 8,020 may signal further downside risks. Monitoring these levels will provide clearer direction for investors.
Data Source - EODHD/Others


 Please wait processing your request...