Highlights
- BAE Systems Plc reports higher gross and net margins than the industry median.
- The company records revenue and profit growth in FY25.
- EBITDA margin and current ratio remain below industry benchmarks.
BAE Systems Plc (LSE:BA.) is a FTSE 100 Index-listed company providing defence and aerospace technologies. The top 10 shareholders collectively hold approximately 45.60% of total shareholding. Capital World Investors and BlackRock Institutional Trust Company, N.A. hold the largest stakes at around 10.32% and 9.93%, respectively.
Financial Performance
For FY25 ended 31 December 2025, revenue stood at GBP 28,336 million compared to GBP 26,312 million in FY24, reflecting a 7.7% increase. Operating profit was reported at GBP 2,925 million versus GBP 2,685 million in the prior year, marking an 8.9% rise. Profit for the year reached GBP 2,151 million, up from GBP 2,041 million, representing a 5.4% increase.
The data indicate that operating profit increased at a higher rate than revenue during the period.
Margin and Liquidity Metrics
The company reported a gross margin of 65.3% in FY25 compared to the industry median of 38.4%. Net margin stood at 7.6%, above the industry median of 6.7%.
On the other hand, EBITDA margin was recorded at 13.6%, lower than the industry median of 15.0%. The current ratio stood at 0.99x compared to the industry median of 1.24x.
Investment Highlights
Order intake exceeded GBP 27 billion year-to-date, reflecting reliance on long-cycle sovereign contracts. This backlog provides revenue visibility and supports utilisation of capital-intensive assets, including submarine and frigate production lines.
The company’s portfolio aligns with NATO defence spending trends, with capabilities spanning missile defence, space systems, and electronic warfare.
Outlook
Revenue and operating profit are expected to continue on a positive trajectory supported by order backlog. Operating profit growth outpacing revenue reflects operational leverage and cost management. The company’s financial position supports continued investment in key programs and shareholder returns.
Stock Information
The stock price has moved down by ~8.13% in the last 1 week and up by over the last 3 months by ~20.77%. The stock has a 52-week high and 52-week low of GBX 2,360.00 and GBX 1,394.00, respectively, and is currently trading above the average of 52-week high-low level.
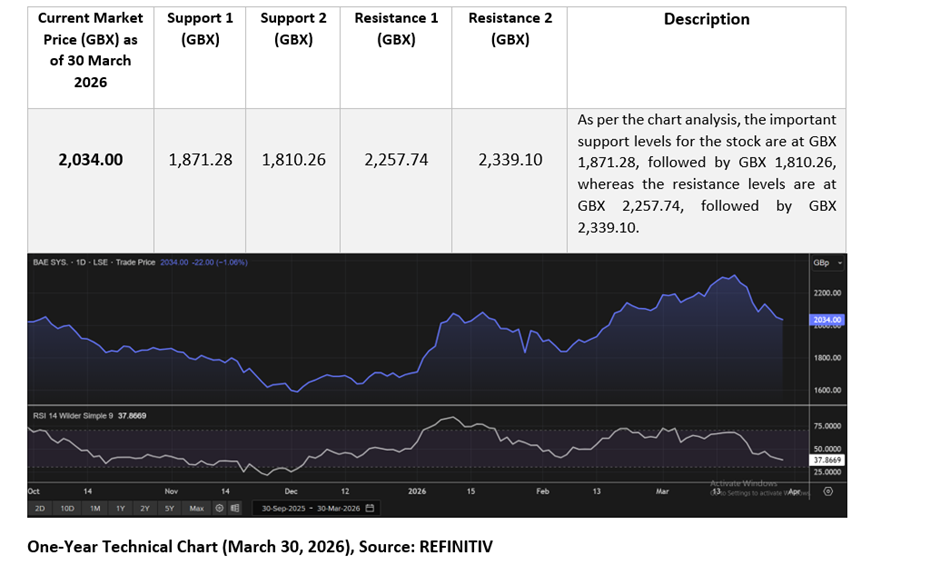
Support and Resistance Summary
Note 1: Past performance is not a reliable indicator of future performance.
Note 2: The reference data for all price data, currency, technical indicators, support, and resistance levels is 30 March 2026. The reference data in this report has been partly sourced from EODHD/Others.
Technical Indicators Defined
Support: A level at which the stock prices tend to find support if they are falling, and a downtrend may take a pause backed by demand or buying interest. Support 1 refers to the nearby support level for the stock and if the price breaches the level, then Support 2 may act as the crucial support level for the stock.
Resistance: A level at which the stock prices tend to find resistance when they are rising, and an uptrend may take a pause due to profit booking or selling interest. Resistance 1 refers to the nearby resistance level for the stock and if the price surpasses the level, then Resistance 2 may act as the crucial resistance level for the stock.


 Please wait processing your request...