_08_23_2025_19_00_04_178290.jpg)
Image source: © 2025 Krish Capital Pty.Ltd
Highlights
- FY24 revenue fell 20.5% to USD 1,180.7M; gross profit declined 27.2%.
- Net profit reached USD 93.7M, reversing a USD 30.8M loss in FY23.
- Outlook supported by Vietnam assets, cost control, and UK North Sea deals.
EnQuest PLC (LSE: ENQ) is an enterprise traded on the FTSE All-Share, an independent energy producer with activities in the United Kingdom North Sea and Malaysia. Its business assets include Magnus, Kraken, Golden Eagle, Greater Kittiwake Area, Scolty/Crathes, and Alba fields.
EnQuest PLC reported total revenue of USD 1,180.7 million in FY24, compared with USD 1,487.4 million in FY23, reflecting a decline of 20.5%. Gross profit also fell to USD 393.3 million from USD 540.6 million, a decrease of 27.2%, mainly due to lower commodity prices, reduced production, and the Magnus crossover gas component. Despite the weaker top line, profit for the year stood at USD 93.7 million, compared with a loss of USD 30.8 million in FY23. The improvement was supported by lower finance costs and higher finance income.
Business Update
The company has reported average Q1 group production of 42,028 Boepd. This exceeds the guidance excluding Vietnam volumes.
Company Outlook
EnQuest has maintained its full-year production guidance, which includes expected contributions from the newly acquired Vietnam assets, supporting stable output across its broader portfolio. A budget covering capital, operating, and decommissioning expenditure has been set, alongside an ongoing cost reduction program aimed at improving capital efficiency and managing cash flows. In addition, the company is engaged in discussions with multiple parties regarding potential UK North Sea transactions, reflecting a strategic focus on consolidation opportunities within its core operating region.
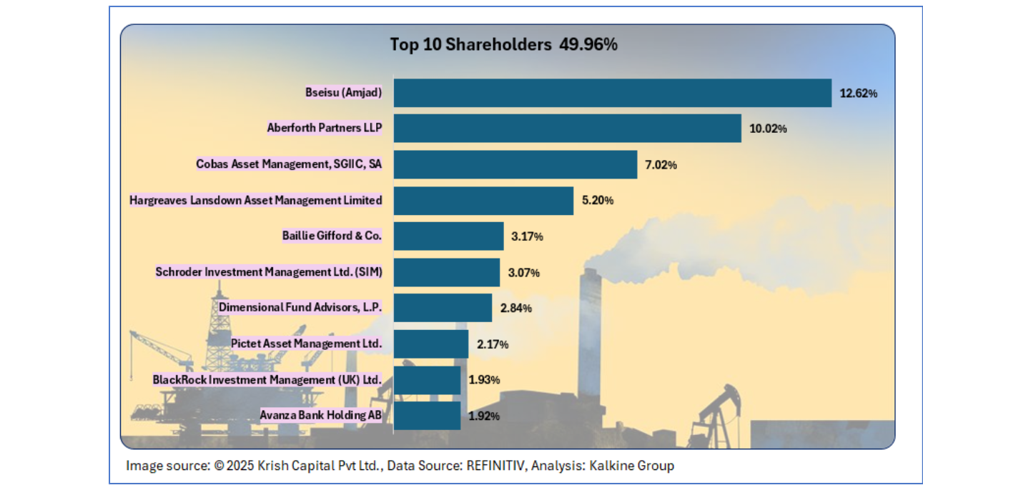
Top 10 Shareholders
The top 10 shareholders together form ~49.96% of the total shareholding in the company. Bseisu (Amjad) and Aberforth Partners LLP are holding maximum stakes in the company at ~12.62% and ~10.02%, respectively.
Stock Information
ENQ closed at GBX 12.39 on 20 August 2025, down 5.36% over the past month and higher by around 7% on a six-month basis. The stock has traded between a 52-week high of GBX 16.60 and a 52-week low of GBX 9.95.
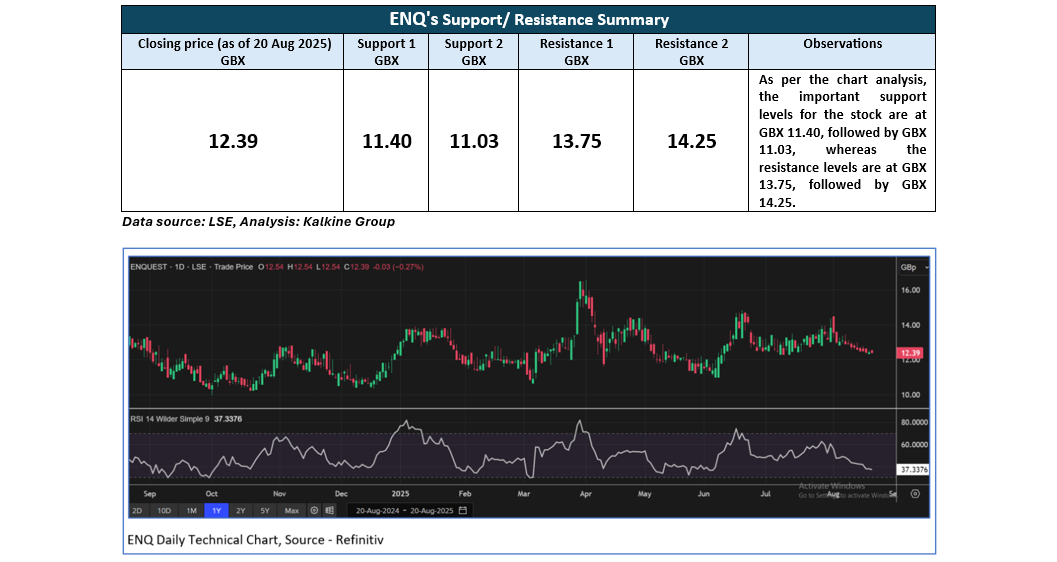
Note 1: Past performance is not a reliable indicator of future performance.
Note 2: The reference data for all price data, currency, technical indicators, support, and resistance levels Is 20 August 2025. The reference data in this report has been partly sourced from EODHD/Others.
Technical Indicators Defined
Support: A level at which the stock prices tend to find support if they are falling, and a downtrend may take a pause backed by demand or buying interest. Support 1 refers to the nearby support level for the stock and if the price breaches the level, then Support 2 may act as the crucial support level for the stock.
Resistance: A level at which the stock prices tend to find resistance when they are rising, and an uptrend may take a pause due to profit booking or selling interest. Resistance 1 refers to the nearby resistance level for the stock and if the price surpasses the level, then Resistance 2 may act as the crucial resistance level for the stock.


 Please wait processing your request...