
Image source: © 2025 Krish Capital Pty.Ltd
Highlights
- FSTA’s FY25 revenue grew 4.8% YoY to GBP 376.3 million, while adjusted PBT up 32% to GBP 27.0 million.
- FSTA increased full-year dividend by 11.3% to 19.76p; final dividend of 12.35p is scheduled to be paid on 24 July 2025.
- FSTA enters FY26 focused on operational efficiency, customer experience, and strategic delivery under new leadership.
Fuller Smith & Turner PLC (LSE: FSTA) is an FTSE All-Share listed premium pubs and hotels group operating managed pubs, boutique hotels, and tenanted inns, offering food, drinks, rooms, and hospitality services.
In the financial year 2025 (FY25), the company’s revenue and other income surged by 4.8% YoY to GBP 376.30 million, boosted by strong performance across the estate. Basic earnings per share increased by 213.3% YoY to 47.49 pence, driven by impressive profit conversion in H1FY25, with adjusted profit before tax rising 32% YoY to GBP 27.0 million. The full-year ordinary dividend per share grew by 11.3% YoY to 19.76 pence, up from 17.75 pence in FY24.
Business Update
FSTA has announced to pay a final dividend of 12.35 pence per share on 24 July 2025 with an ex-dividend date of 03 July 2025.
Company Outlook
Looking ahead, the business is focused on driving operational efficiency and enhancing customer experience, while the leadership transition sets the stage for long-term strategic delivery. With a balanced portfolio and sustained momentum, Fuller looks forward to navigate evolving market dynamics and deliver further value.
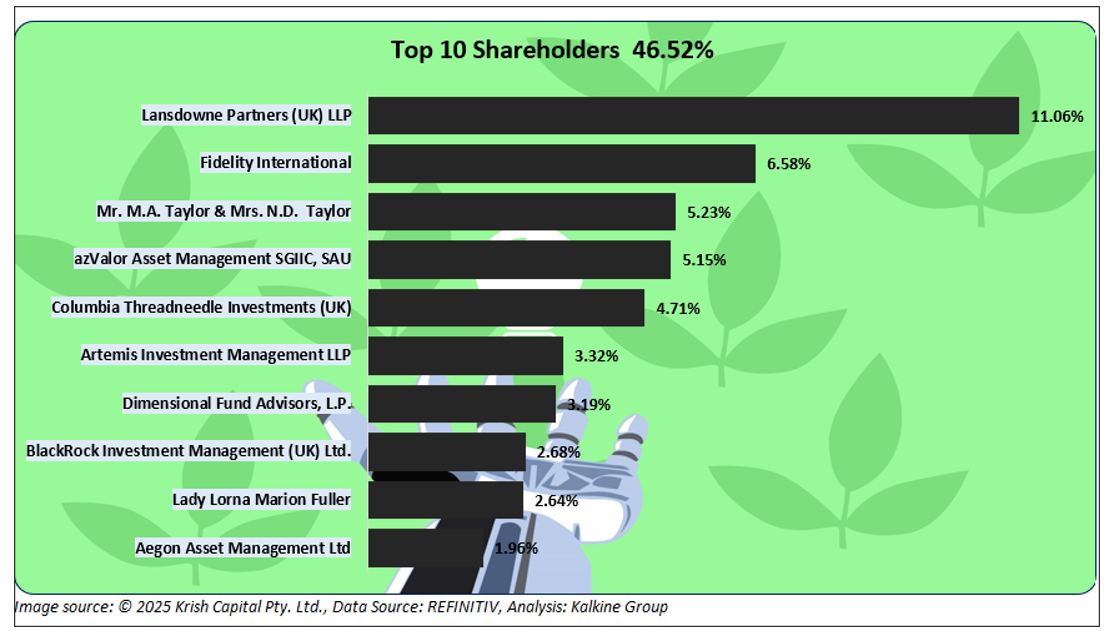
Top 10 Shareholder
The top 10 shareholders collectively hold approximately 46.52% of the company’s total equity, with Lansdowne Partners (UK) LLP and Fidelity International being the largest investors, owning around 11.06% and 6.58%, respectively.
Stock Information
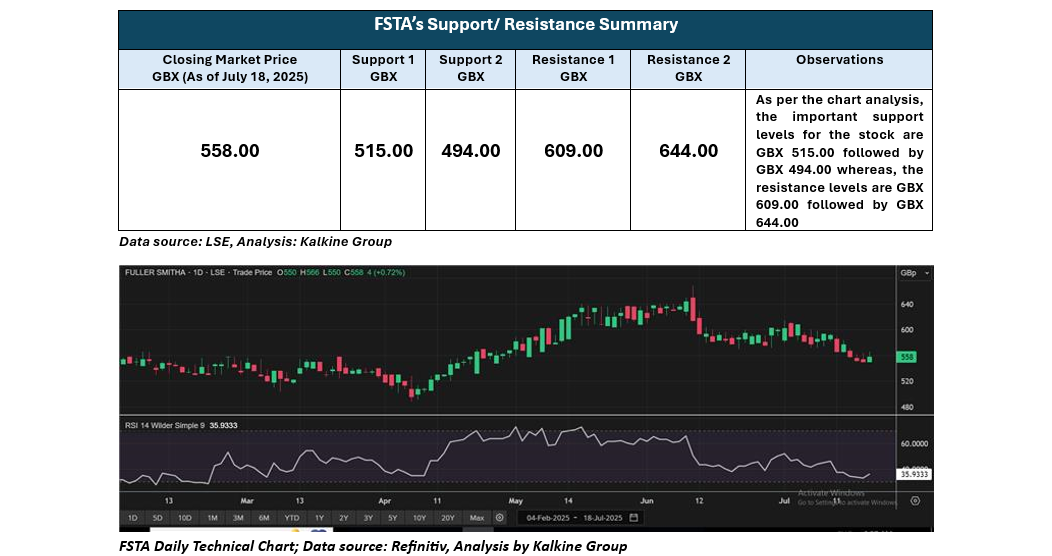
The stock has declined by approximately 4.45% over the past month and 3.46% over the past six months. As of 18 July 2025, the stock closed at GBX 558, trading above the average of the 52-week low of GBX 488 and the 52-week high of GBX 780.
Note 1: Past performance is not a reliable indicator of future performance.
Note 2: The reference data for all price data, currency, technical indicators, support, and resistance levels is 18 July 2025. The reference data in this report has been partly sourced from EODHD/Others.
Technical Indicators Defined
Support: A level at which the stock prices tend to find support if they are falling, and a downtrend may take a pause backed by demand or buying interest. Support 1 refers to the nearby support level for the stock and if the price breaches the level, then Support 2 may act as the crucial support level for the stock.
Resistance: A level at which the stock prices tend to find resistance when they are rising, and an uptrend may take a pause due to profit booking or selling interest. Resistance 1 refers to the nearby resistance level for the stock and if the price surpasses the level, then Resistance 2 may act as the crucial resistance level for the stock.


 Please wait processing your request...