Image source: Shutterstock
Highlights
- Gulf Keystone’s FY24 revenue rose 22.4% YoY to USD 151.2 million, driven by an 86% surge in average daily production
- The company posted a profit after tax of USD 7.2 million in FY24, reversing a loss of USD 11.5 million in FY23
- A total of USD 45 million was returned to shareholders in March 2025 through dividends and share buybacks
- Gulf Keystone maintains FY25 gross production guidance of 40,000–45,000 bopd, backed by YTD output of ~46,400 bopd
Gulf Keystone Petroleum Limited (LSE:GKP) is a main market-listed oil and gas company, operating primarily in the Kurdistan Region of Iraq, with additional activities based in the United Kingdom.
In the financial year 2024 (FY24), Gulf Keystone Petroleum reported revenue of USD 151.2 million, up 22.4% year-on-year, driven by an 86% increase in average daily production to 40,689 bopd, which helped offset a 34% decline in realised prices.
Adjusted EBITDA rose by 51.9% YoY to USD 76.1 million, supported by a higher volume of local sales despite a drop in average realised price to USD 26.8/bbl. The company also posted a profit after tax of USD 7.2 million, a significant turnaround from a loss of USD 11.5 million in FY 2023, due to higher operating margins, reduced share-based compensation, and stable financing costs.
Recent Business Update
On March 20, 2025, the company announced a total shareholder return of USD 45 million. This included USD 35 million in dividends and USD 10 million in share buybacks, carried out under the repurchase programme launched in May 2024.
Company Outlook
Gulf Keystone has maintained its gross production guidance at 40,000–45,000 bopd for FY25, supported by a year-to-date average of approximately 46,400 bopd. The company plans net capital expenditure of USD 25–30 million, focused on field safety and operational optimisation.
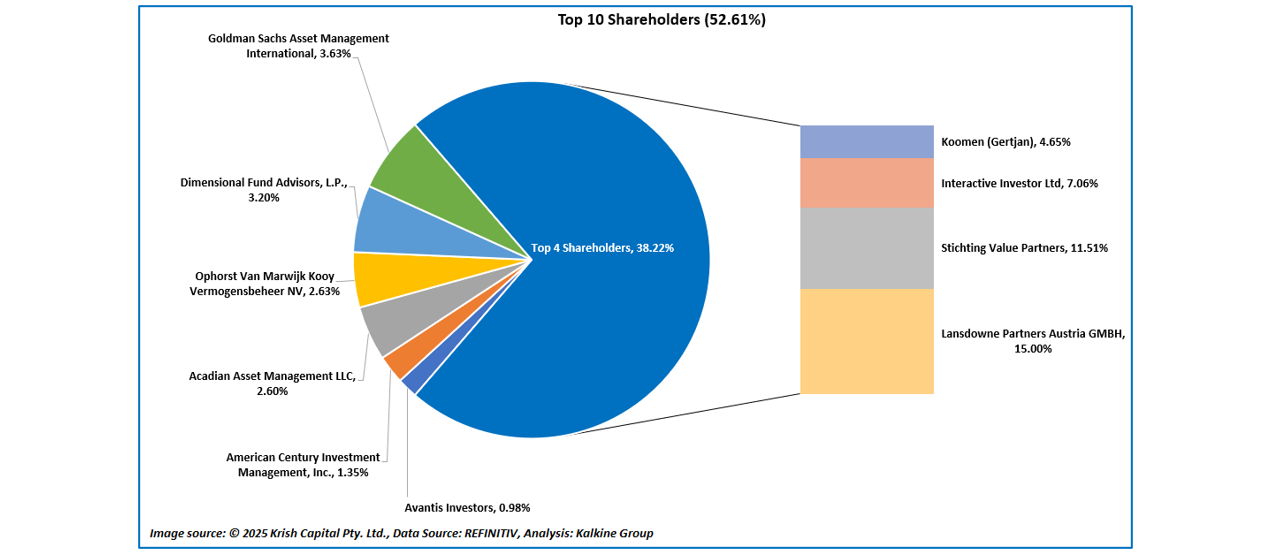
Top 10 Shareholders
The top 10 shareholders of GKP together hold approximately 52.61% of the total shares. Lansdowne Partners Austria GMBH is the largest shareholder, owning around 15.00%. Stichting Value Partners follows with about 11.51%, as shown in the chart below.
Stock Information
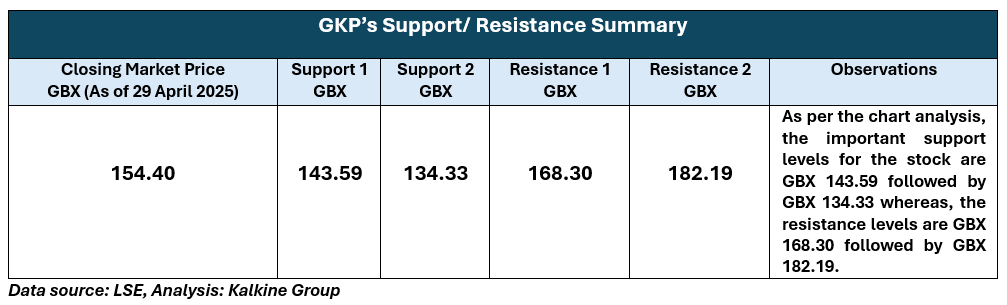
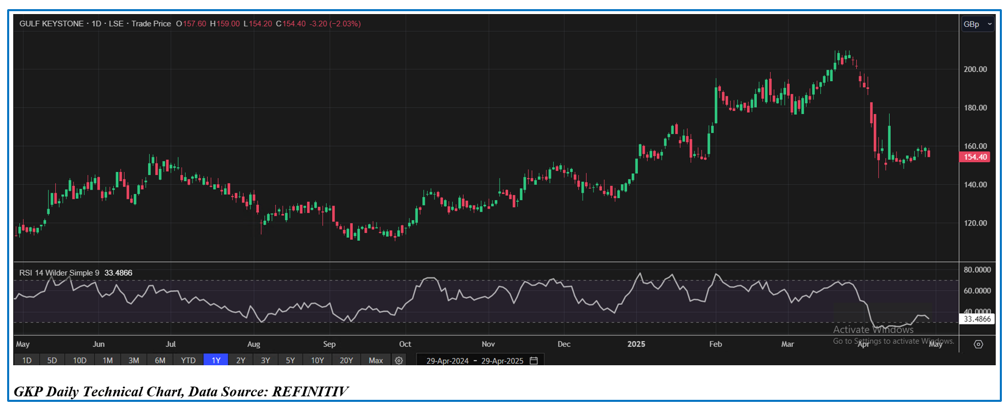
Over the past six months, the stock has risen approximately 20.62%. It has a 52-week range between GBX 110.44 and GBX 209.80 and closed at GBX 154.40 on 29 April 2025, trading below the average of its 52-week high-low range.
Note 1: Past performance is not a reliable indicator of future performance.
Note 2: The reference data for all price data, currency, technical indicators, support, and resistance levels is 29 April 2025. The reference data in this report has been partly sourced from EODHD/Others.
Technical Indicators Defined
Support: A level at which the stock prices tend to find support if they are falling, and a downtrend may take a pause backed by demand or buying interest. Support 1 refers to the nearby support level for the stock and if the price breaches the level, then Support 2 may act as the crucial support level for the stock.
Resistance: A level at which the stock prices tend to find resistance when they are rising, and an uptrend may take a pause due to profit booking or selling interest. Resistance 1 refers to the nearby resistance level for the stock and if the price surpasses the level, then Resistance 2 may act as the crucial resistance level for the stock.


 Please wait processing your request...