_08_11_2025_03_56_56_620493.png)
Image source: © 2025 Krish Capital Pty.Ltd
Highlights
- PHAR reported FY24 revenue of USD 136.1 million, down 19% YoY.
- PHAR paid a final FY24 dividend of USD 0.847 per share on 31 July 2025.
- PHAR aims to cut emissions by 5% (2024–2026) via efficiency gains and lower carbon fuel use.
Pharos Energy PLC (LSE: PHAR) is an independent oil and gas company with production, development, and exploration interests in Egypt and Vietnam.
In the financial year 2024 (FY24), the company reported a 19.0% YoY decline in revenue to USD 136.1 million, compared to USD 168.0 million in FY23, primarily due to an 18% drop in sales volumes, partly from cargo timing and a refinery shutdown at Dung Quat in Vietnam. Profit for the year stood at USD 23.6 million, reversing a loss of USD 48.8 million in FY23, due to reversal of impairments (USD 19.9 million post-tax) and lower finance costs as the company became debt-free in 2024. Net cash from operating activities rose 20.3% YoY to USD 54.0 million, up from USD 44.9 million in FY23.
Business Update
PHAR paid a final FY24 dividend of USD 0.847 per share on 31 July 2025.
Company Outlook
In 4Q FY25, PHAR plans to drill one TGT appraisal well, three infill wells, and one CNV infill well, aiming to boost production and convert resources. A two-year extension request, LLI orders, and ongoing farm-out talks support future growth with limited near-term capital exposure.
Pharos raised its dividend by 10% YoY to GBX 1.21, completed a USD 3.0 million buyback, and remains focused on capital discipline and shareholder returns. The company is on track to cut emissions by 5% (2024–2026) through process optimisation and reduced carbon-intensive fuel use.
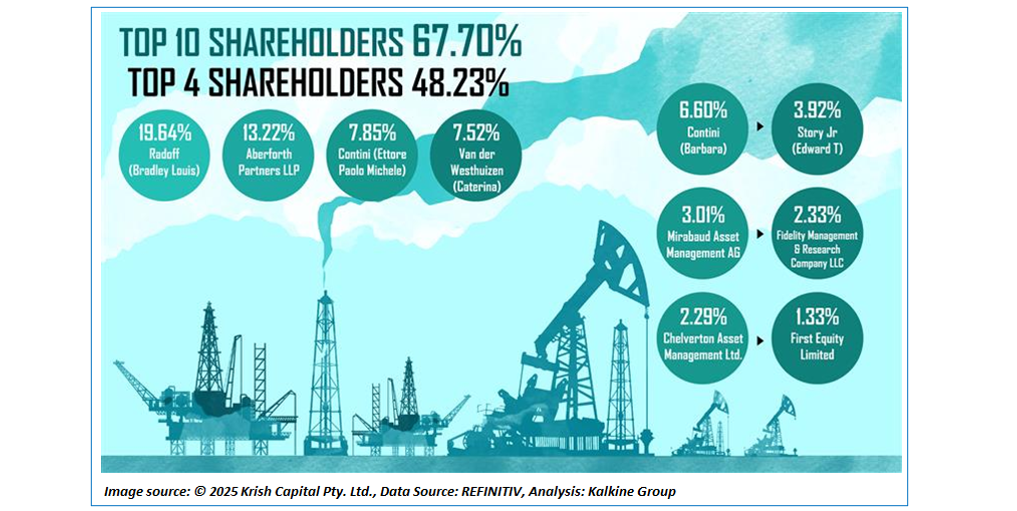
Top 10 Shareholder
The top 10 shareholders collectively hold approximately 67.70% of Pharos Energy, with the largest stakes held by Radoff (Bradley Louis) at around 19.64% and Aberforth Partners LLP at approximately 13.22%.
Stock Information
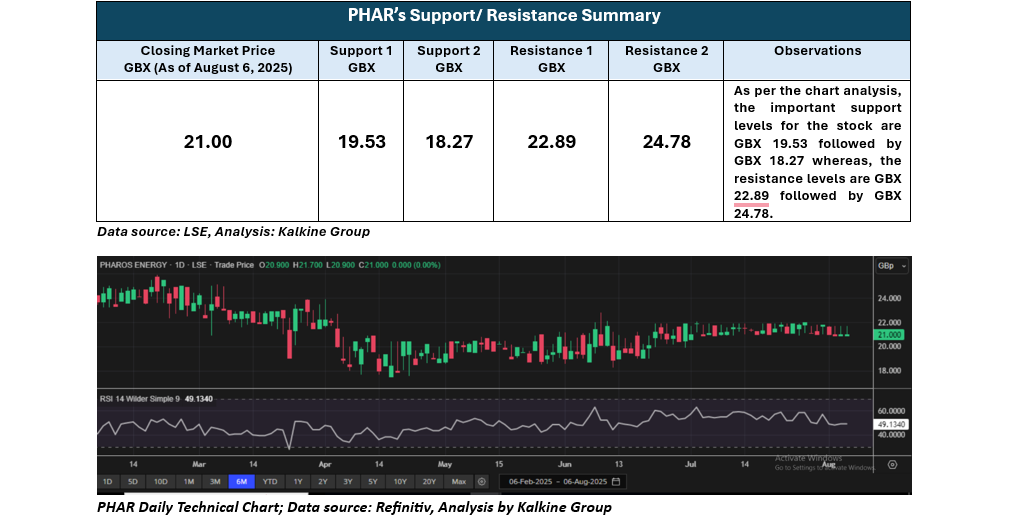
The stock has risen by approximately 0.47% over the past month but declined 12.86% over the past six months. As of 06 August 2025, the stock closed at GBX 21.00, trading below the average of its 52-week high of GBX 27.98 and 52-week low of GBX 17.5.
Note 1: Past performance is not a reliable indicator of future performance.
Note 2: The reference data for all price data, currency, technical indicators, support, and resistance levels is 6 August 2025. The reference data in this report has been partly sourced from EODHD/Others.
Technical Indicators Defined
Support: A level at which the stock prices tend to find support if they are falling, and a downtrend may take a pause backed by demand or buying interest. Support 1 refers to the nearby support level for the stock and if the price breaches the level, then Support 2 may act as the crucial support level for the stock.
Resistance: A level at which the stock prices tend to find resistance when they are rising, and an uptrend may take a pause due to profit booking or selling interest. Resistance 1 refers to the nearby resistance level for the stock and if the price surpasses the level, then Resistance 2 may act as the crucial resistance level for the stock.


 Please wait processing your request...