This report is an updated version of the report published on 14 April 2025 at 1:24PM AEST.
Global Tariff Report
Amid global trade tensions rattling the market, Kalkine’s Global Tariff Report, intends to evaluate the key sectors impacted globally, associated risks with the stocks within those sectors, looking at key fundamentals and valuation metrics and offering macro and micro insights to provide clarity for investors.
As illustrated in the table below, several key sectors in different countries are directly impacted by the recent tariff announcement from President Trump.
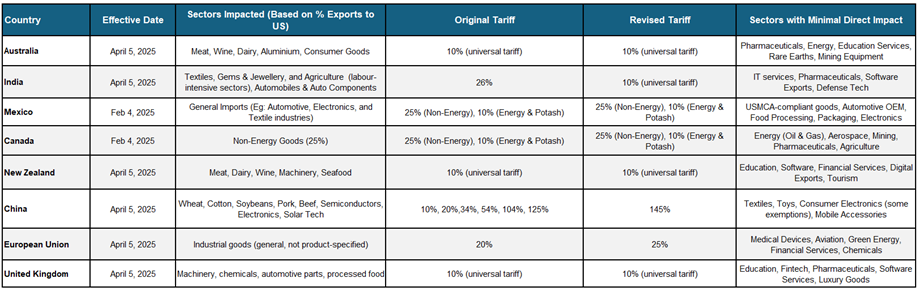
Source: White House, Analysis by Kalkine, Data as on 14 April 2025
Key Points under Consideration
- On 5th April a baseline tariff of 10% on almost all imports to the US was implemented.
- On April 9th, the Trump administration announced a 90-day suspension of additional tariffs beyond the “base” 10% tariff applicable to all countries.
- US Tariffs on goods imported from Canada, Mexico and China will not be impacted by 90-days pause on tariffs.
- President Trump has exempted smartphones, computers and some other electronic devices from "reciprocal" tariffs, including the 145% levies imposed on Chinese imports.
- There are exceptions under the new tariffs for certain products, including energy products like oil, copper, pharmaceuticals, semiconductors, and lumber, all of which may become subject to separate tariffs.
After the U.S. imposed a 10-percent baseline tariff on its trade partners, global markets reacted sharply. In Australia, the stock market declined more than 6%, and the Australian dollar dropped to its lowest level in five years. Affected sectors could include agriculture, mining, and wine exports, which form a substantial portion of Australia's outbound trade to the US.
The US has increased tariffs on Chinese critical minerals, including tariff on natural graphite. This move benefits Australian miners by making their exports more competitive.
China’s recent export restrictions on rare earth minerals, particularly those vital for semiconductor manufacturing, have intensified global supply chain concerns, leading to increased prices and heightened demand. Western Australia’s rare earth industry stands to benefit, supported by its exemption from US tariffs and strong reputation as a leading mining region. However, despite its strategic position to help address global shortages, the sector faces ongoing uncertainty due to potential retaliatory trade actions and growing scrutiny over environmental impacts.
Why are Western Australia’s (WA) Rare Earth Miners Expected to Gain?
Western Australia’s resource sector has locked key exemptions from US tariffs, including iron ore, gold, LNG, and rare earths. These exemptions highlight WA’s global significance, contributing nearly 40% of the world’s lithium and 10% of rare earth oxides. According to the WA Chamber of Minerals and Energy (CME), these commodities are essential to the US manufacturing and defense industries, reinforcing WA’s strategic value in global supply chains.
This report explores the interaction of these factors, providing insights into market opportunities, risks, and the long-term impact on one of the Australia's critical mineral stocks named Arafura Rare Earths Ltd. (ASX: ARU), headquartered in Perth, Western Australia.

1.1: Company Overview: Arafura Rare Earths Limited (ASX: ARU) engages in the exploration and development of mineral properties in Australia, which focuses on the production of rare earth products, such as neodymium-praseodymium and mixed middle-heavy rare earth oxides. Kalkine’s Global Tariff Report covers the Investment Highlights, Management Insights, Key Financial Metrics, Risks, Technical Analysis along with the Valuation, Target Price, and Recommendation on the stock.

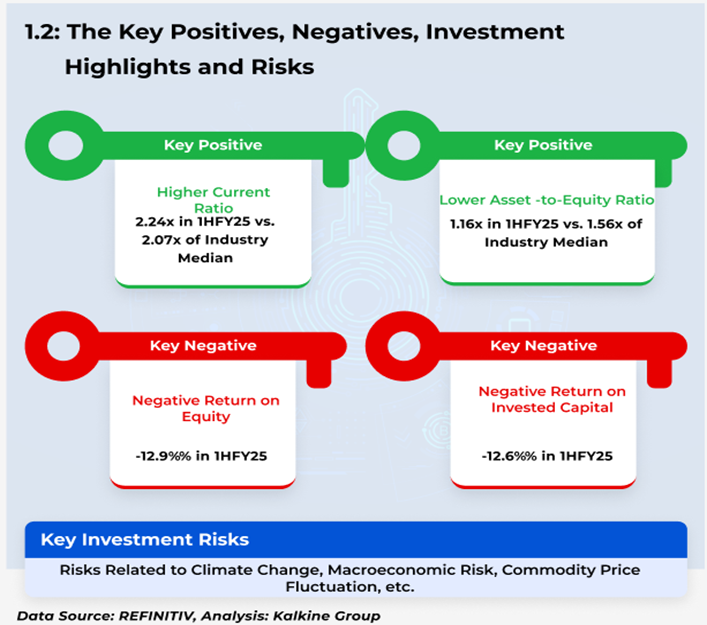
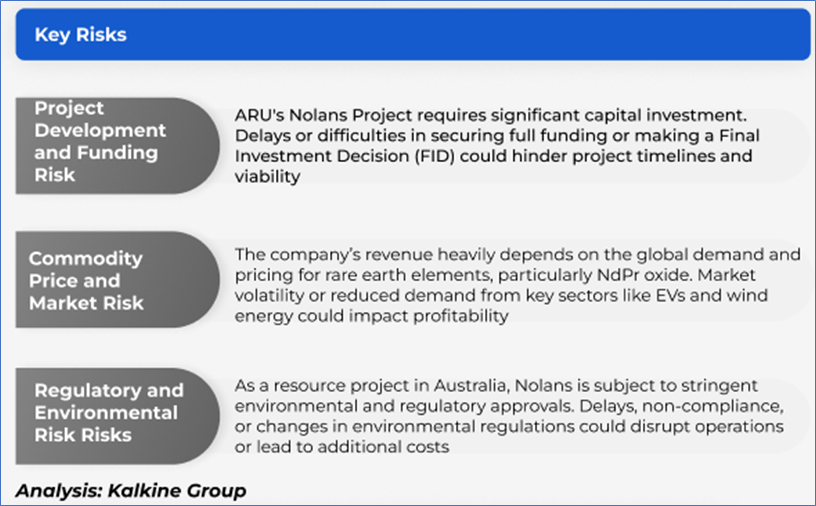
1.2: The Key Positives, Negatives, Investment Highlights, and Risks:
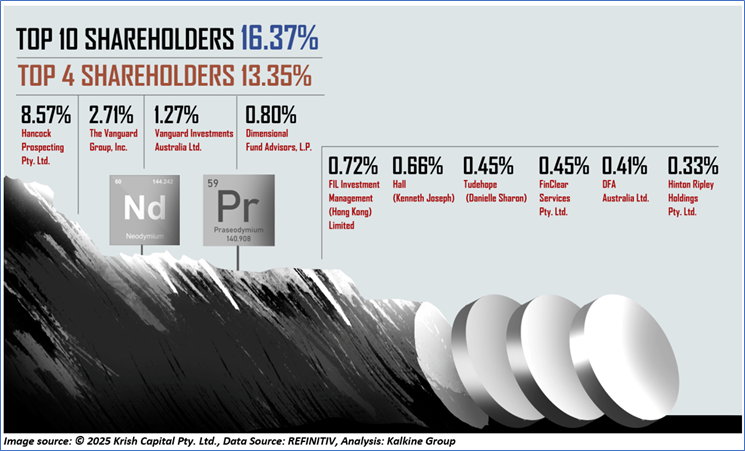
1.3: Top 10 Shareholders: The top 10 shareholders together form ~16.37% of the total shareholding. Hancock Prospecting Pty. Ltd. and The Vanguard Group, Inc. are holding maximum stakes in the company at ~8.57% and ~2.71%, respectively.
1.4: Key Metrics: Debt-to-Equity ratio stood at 0.00x in 1HFY25 compared with the industry median of 0.12x. Below is captured the metrics showing the trend of asset-to-equity ratio and current ratio


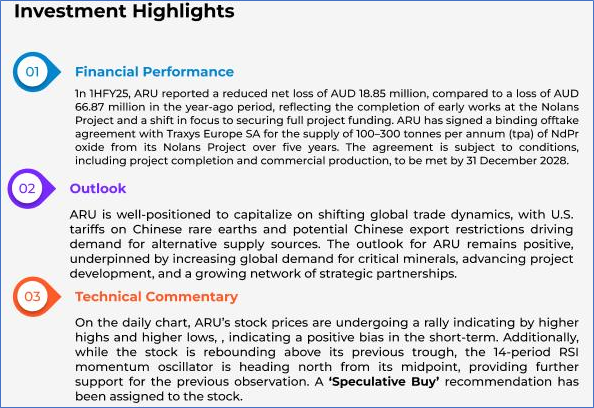
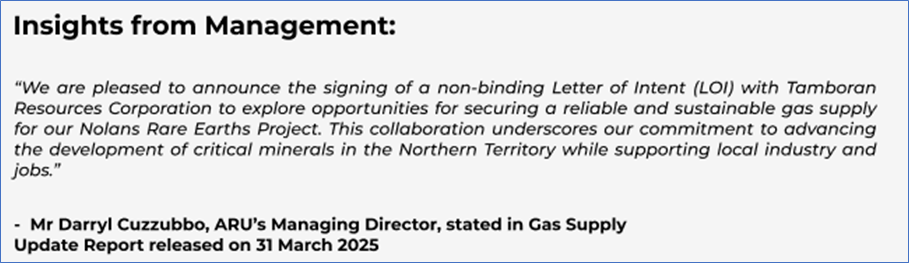
2.1: Recent Business Updates:

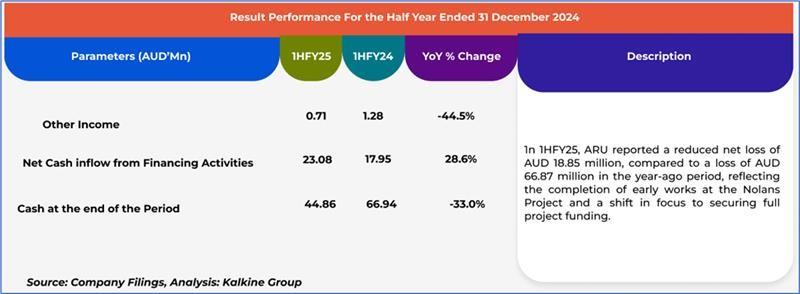
2.2: Financial Insights:
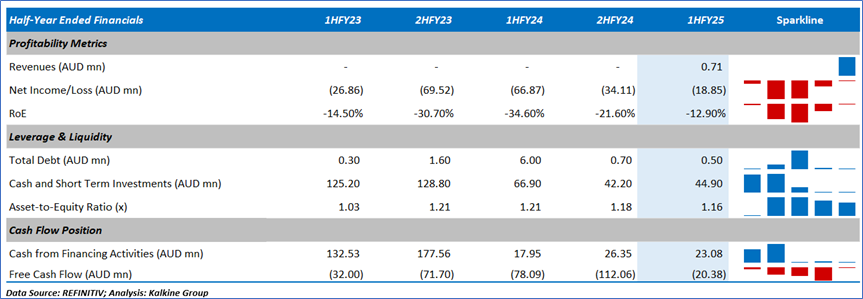
2.3: Historical Financial Trend:


4.1: Price Performance and Technical Summary
The stock price has gone up by ~4.54% in the last one month and over the last six months, stock prices went down by ~1.42%. The stock has a 52-week low and 52-week high of AUD 0.105 and AUD 0.210, respectively, and is currently trading above the mid-range of the 52-week-high-low levels. ARU was last covered in a report dated ’14 March 2025’.


4.2: Technical Commentary and Stock Recommendation

Markets are trading in a highly volatile zone currently due to certain macro-economic issues and geopolitical tensions prevailing. Therefore, it is prudent to follow a cautious approach while investing.
Note 1: Past performance is neither an indicator nor a guarantee of future performance.
Note 2: The reference date for all price data, currency, technical indicators, support, and resistance levels is 14 April 2025. The reference data in this report has been partly sourced from REFINITIV.
Note 3: Investment decisions should be made depending on an individual's appetite for upside potential, risks, holding duration, and any previous holdings. An 'Exit' from the stock can be considered if the Target Price mentioned as per the Valuation and or the technical levels provided has been achieved and is subject to the factors discussed above.
Note 4: Kalkine reports are prepared based on the stock prices captured either from REFINITIV or Trading View. Typically, REFINITIV or Trading View may reflect stock prices with a delay which could be a lag of 25-30 minutes. There can be no assurance that future results or events will be consistent with the information provided in the report. The information is subject to change without any prior notice.
Technical Indicators Defined: -
Support: A level at which the stock prices tend to find support if they are falling, and a downtrend may take a pause backed by demand or buying interest. Support 1 refers to the nearby support level for the stock and if the price breaches the level, then Support 2 may act as the crucial support level for the stock.
Resistance: A level at which the stock prices tend to find resistance when they are rising, and an uptrend may take a pause due to profit booking or selling interest. Resistance 1 refers to the nearby resistance level for the stock and if the price surpasses the level, then Resistance 2 may act as the crucial resistance level for the stock.
Stop-loss: It is a level to protect further losses in case of unfavourable movement in the stock prices.
Disclaimer-
This report has been issued by Kalkine Limited (Company number 07903332), a private limited company, incorporated in England and Wales ("Kalkine”). Kalkine.co.uk and associated pages are published by Kalkine. Kalkine is authorised and regulated by the Financial Conduct Authority under reference number 579414.
The information in this report and on the Kalkine website has been prepared from a wide variety of sources, which Kalkine, to the best of its knowledge and belief, considers accurate. Kalkine has made every effort to ensure the reliability of information contained in its reports, newsletters and websites. All information represents our views at the date of publication and may change without notice. The information in this report does not constitute an offer to sell securities or other financial products or a solicitation of an offer to buy securities or other financial products. Our reports contain non personalized recommendations to invest in securities and other financial products.
Kalkine does not offer financial advice based upon your personal financial situation or goals, and we shall not be held liable for any investment or trading losses you may incur by using the opinions expressed in our reports, publications, market updates, news alerts and corporate profiles. Kalkine does not intend to exclude any liability which it is not permitted to exclude under applicable law or regulation. Kalkine’s non-personalised advice does not in any way endorse or recommend individuals, investment products or services for your personal financial situation. You should discuss your portfolios and the risk tolerance level appropriate for your personal financial situation, with a professional authorised financial planner and adviser. You should be aware that the value of any investment and the income from it can go down as well as up and you may not get back the amount invested.
Please also read our Terms & Conditions for further information. Employees and/or associates of Kalkine and its related entities may hold interests in the securities or other financial products covered in this report or on the Kalkine website. Any such employees and associates are required to comply with certain safeguards, procedures and disclosures as required by law.
Kalkine Media Limited, an affiliate of Kalkine, may have received, or be entitled to receive, financial consideration in connection with providing information about certain entity(s) covered on its website including entities covered in this report.
Past performance is not a reliable indicator of future performance.

 Please wait processing your request...