0R15 9025.0 0.0% 0R1E 9410.0 0.0% 0M69 None None% 0R2V 247.99 9682.643% 0QYR 1567.5 0.0% 0QYP 439.3701 -2.9016% 0RUK None None% 0RYA 1597.0 1.2682% 0RIH 195.55 0.0% 0RIH 191.4 -2.1222% 0R1O 225.5 9683.0803% 0R1O None None% 0QFP 10475.8496 107.8542% 0M2Z 252.573 0.2373% 0VSO 33.0 -7.3164% 0R1I None None% 0QZI 622.0 0.0% 0QZ0 220.0 0.0% 0NZF None None% 0YXG 222.05 -4.1318%

Section 1: Company Overview and Fundamentals
1.1 Company Overview:
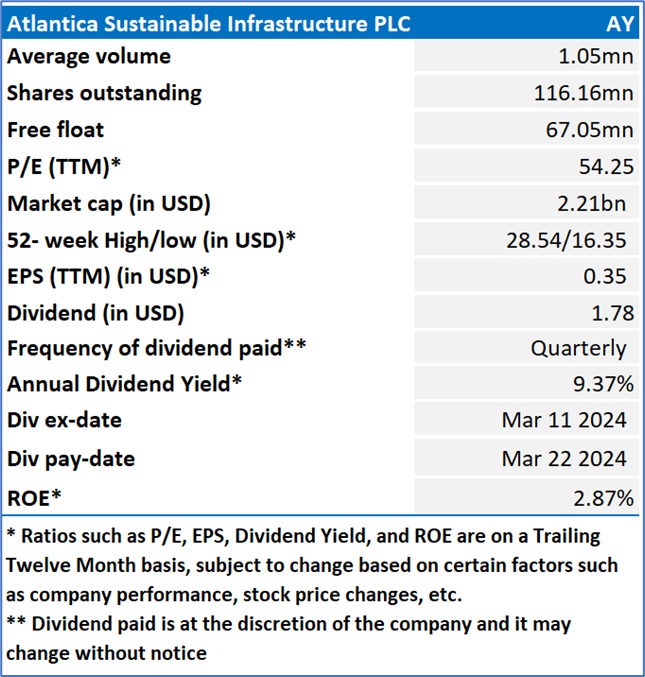
Atlantica Sustainable Infrastructure Plc (NASDAQ: AY) is a sustainable infrastructure company with most of its business in renewable energy assets. It owns and manages operating facilities and projects under development in North America (United States, Canada, and Mexico), South America (Peru, Chile, Colombia and Uruguay) and EMEA (Spain, Italy, Algeria and South Africa). The Company's assets are organized into four business sectors: renewable energy, efficient natural gas and heat, transmission lines and water.
Kalkine’s Dividend Income Report covers the Company Overview, Key positives & negatives, investment summary, Business updates and insights into company recent financial results, Key Risks & Outlook, Price performance and technical summary, Target Price, and Recommendation on the stock.
Stock Performance:
1.2 The Key Positives, Negatives, and Investment summary

1.3 Key Metrics:
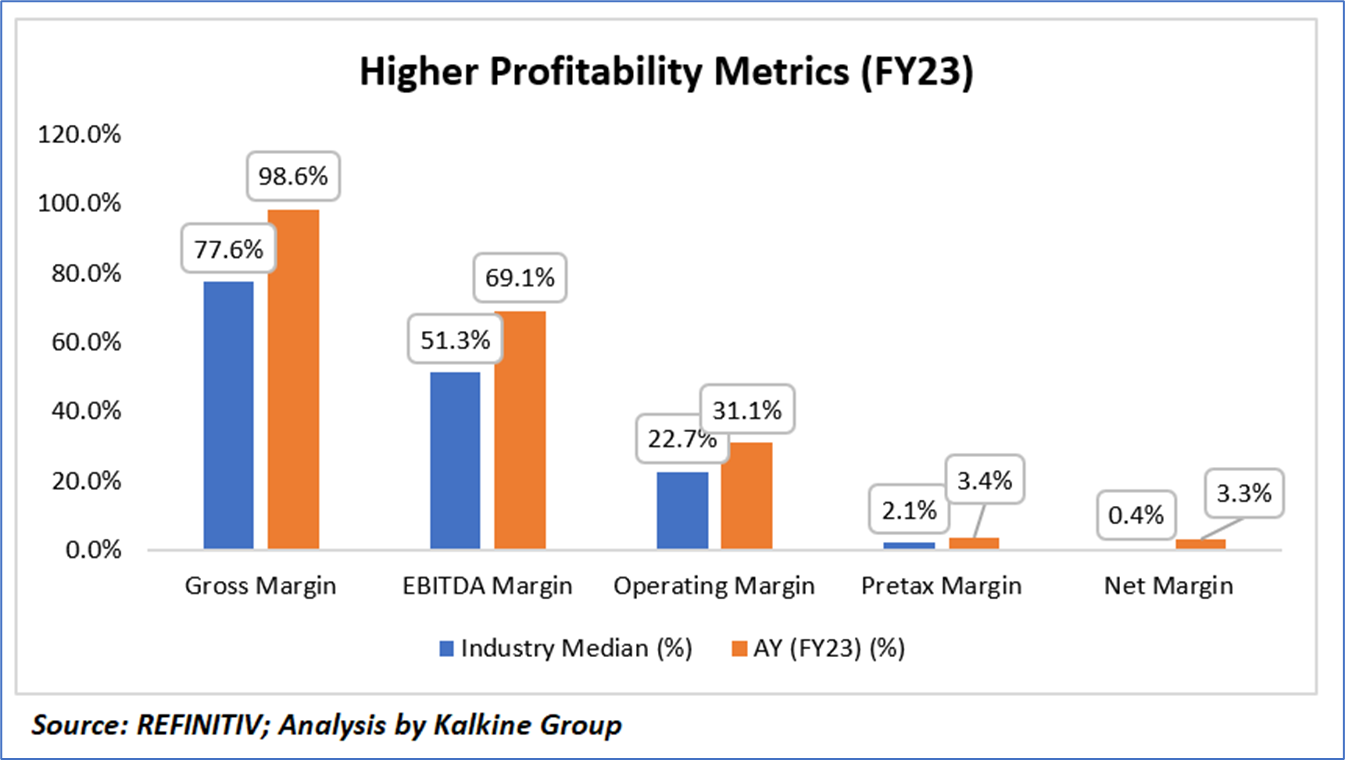
In FY23, Atlantica Sustainable Infrastructure plc (AY) exhibited notably superior financial performance compared to industry benchmarks across various key metrics. AY's gross margin of 98.6% significantly outperformed the industry median of 77.6%, indicating efficient cost management and potentially higher pricing power. Similarly, AY's EBITDA margin of 69.1% surpassed the industry median of 51.3%, reflecting strong operational efficiency and profitability. Operating margin also demonstrated AY's operational prowess, standing at 31.1% compared to the industry median of 22.7%. Furthermore, AY's pretax margin of 3.4% exceeded the industry median of 2.1%, suggesting effective management of operating expenses and other costs. AY's net margin of 3.3% further underscores its ability to generate profits after accounting for all expenses, surpassing the industry median of 0.4%. This robust financial performance positions AY as a standout performer within its industry, highlighting its efficiency and profitability compared to industry peers.
1.4 Top 10 shareholders:
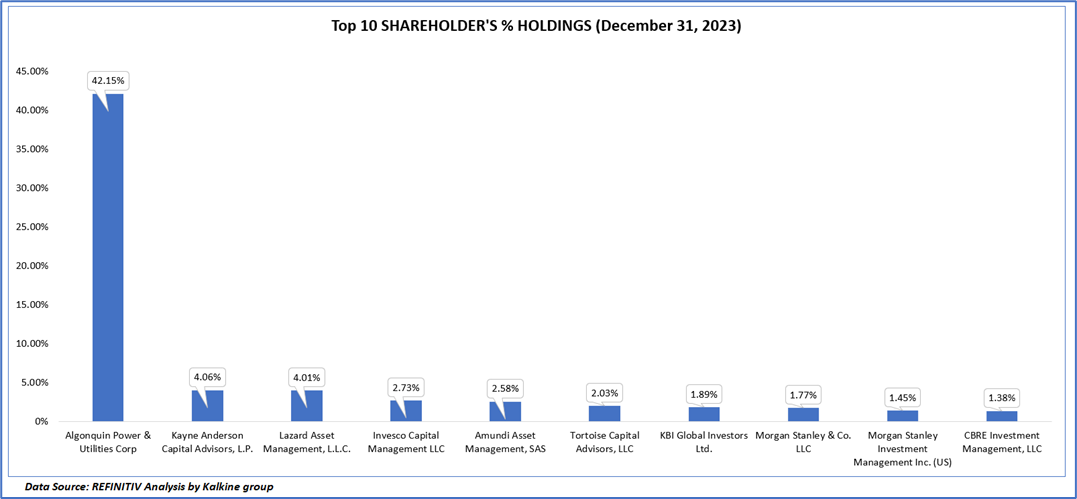
The top 10 shareholders together form ~64.05% of the total shareholding, signifying concentrated shareholding. Algonquin Power & Utilities Corp, and Kayne Anderson Capital Advisors, L.P. are the biggest shareholders, holding the maximum stake in the company at ~ 42.15% and ~ 4.07%, respectively.
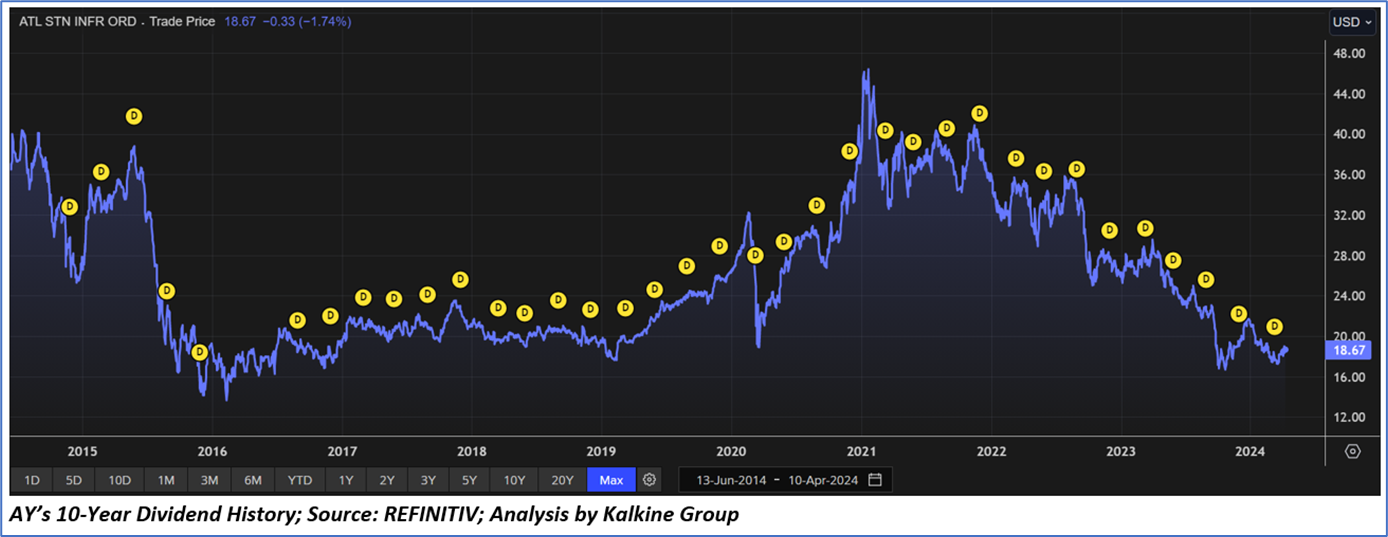
1.5 Consistent Dividend Payment History
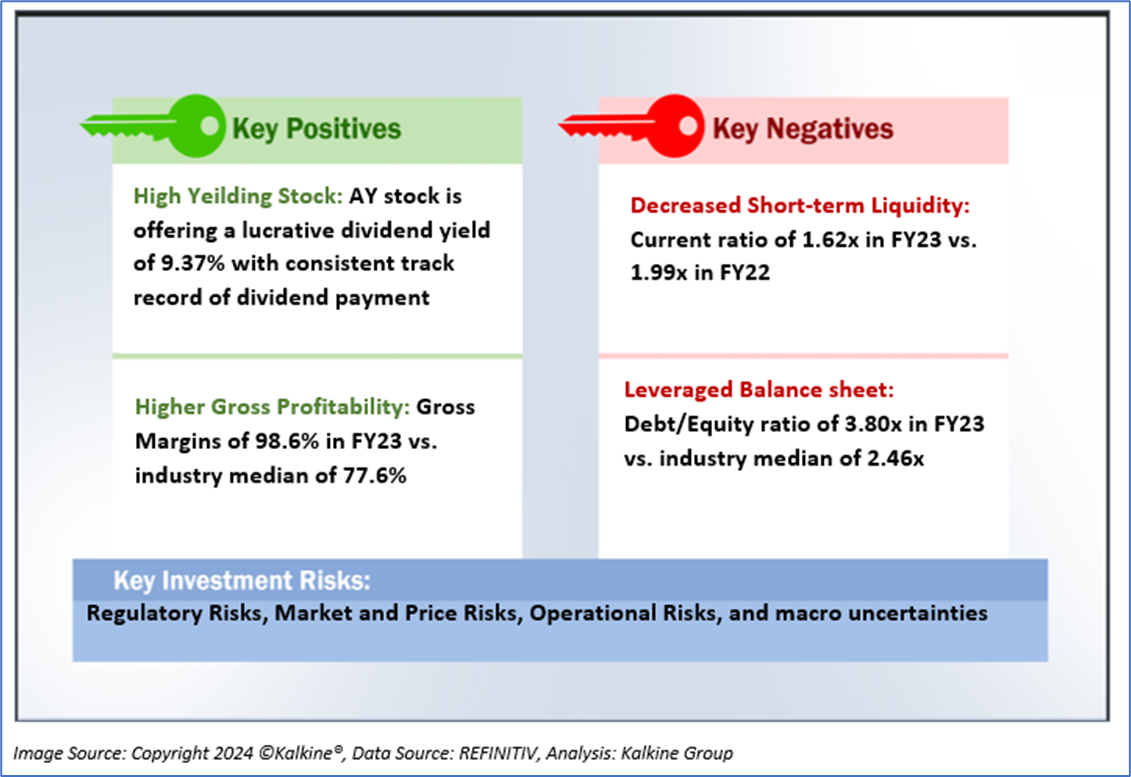
Atlantica Sustainable Infrastructure plc (AY) upholds its commitment to shareholder value by maintaining a consistent dividend payment history, reflective of its focus on investor returns. These dividends, typically disbursed quarterly, are determined based on the company's financial performance, cash flow, and strategic allocation of capital. AY aims to sustain a balanced dividend policy that rewards shareholders while also facilitating investment in growth initiatives and debt reduction efforts. Recently, on February 29, 2024, the Board of Directors approved a dividend of USD0.445 per share, reinforcing AY's dedication to delivering value to its shareholders. This dividend is slated for payment on March 22, 2024, to shareholders of record as of March 12, 2024. Overall, AY's consistent dividend payments underscore its commitment to shareholder returns, positioning it as an attractive investment option for those seeking stable income opportunities in the renewable energy and infrastructure sectors.
Section 2: Business Updates and Corporate Business Highlights
2.1 Recent Updates:
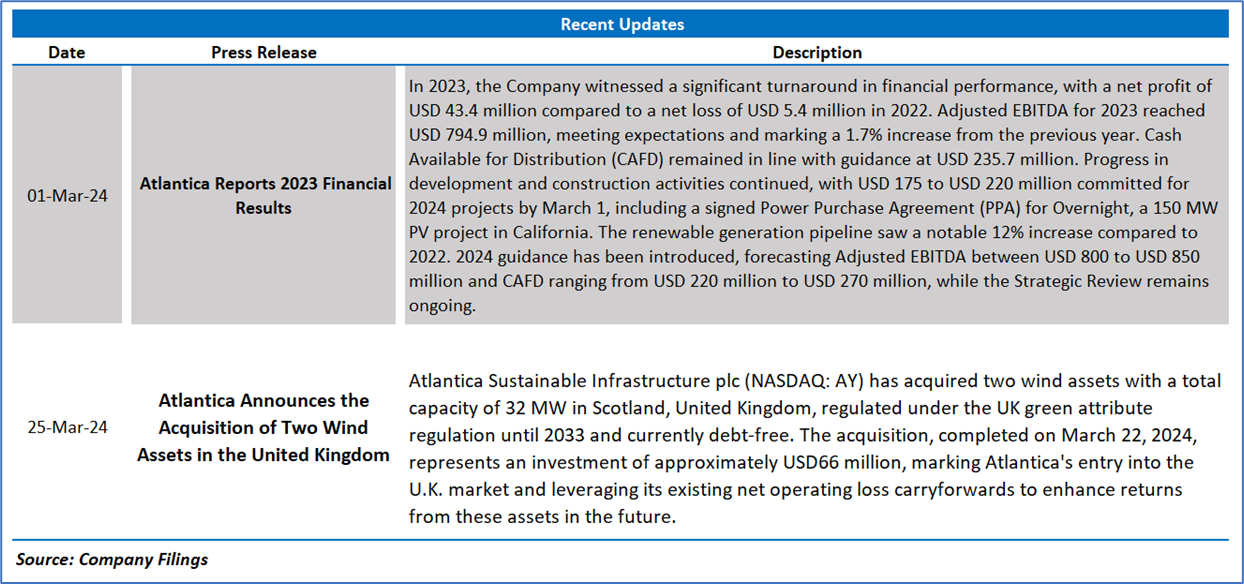
The below picture gives an overview of the recent updates:
2.2 Insights of FY23:

Section 3: Key Risks and Outlook:

Section 4: Stock Recommendation Summary:
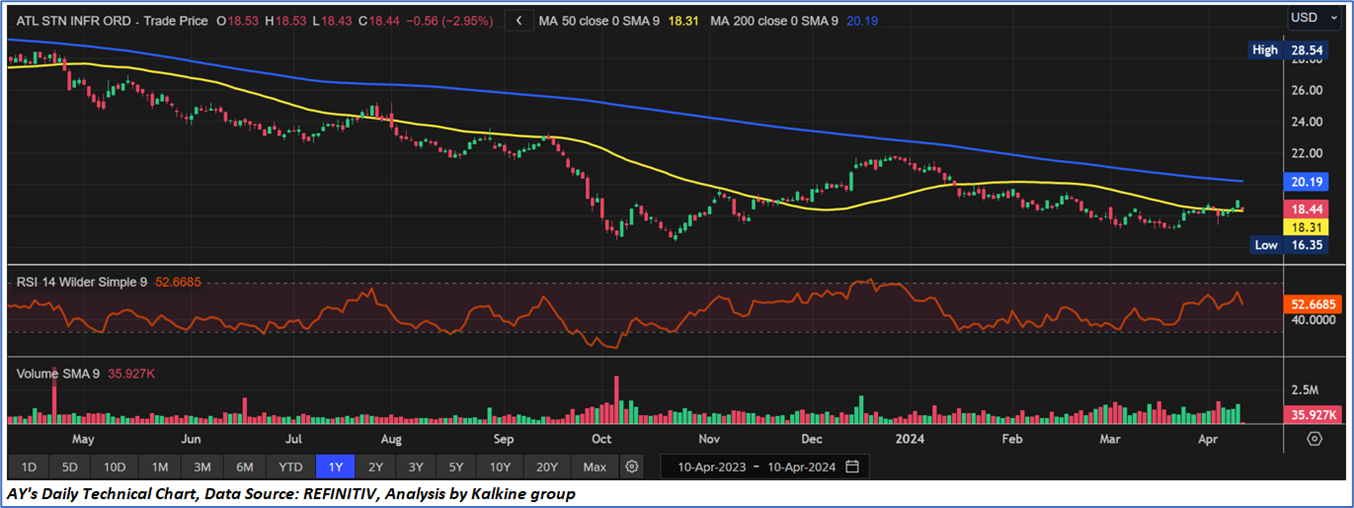
4.1 Price Performance and Technical Summary:
Stock Performance:

4.2 Fundamental Valuation
Valuation Methodology: EV/Sales per share Multiple Based Relative Valuation
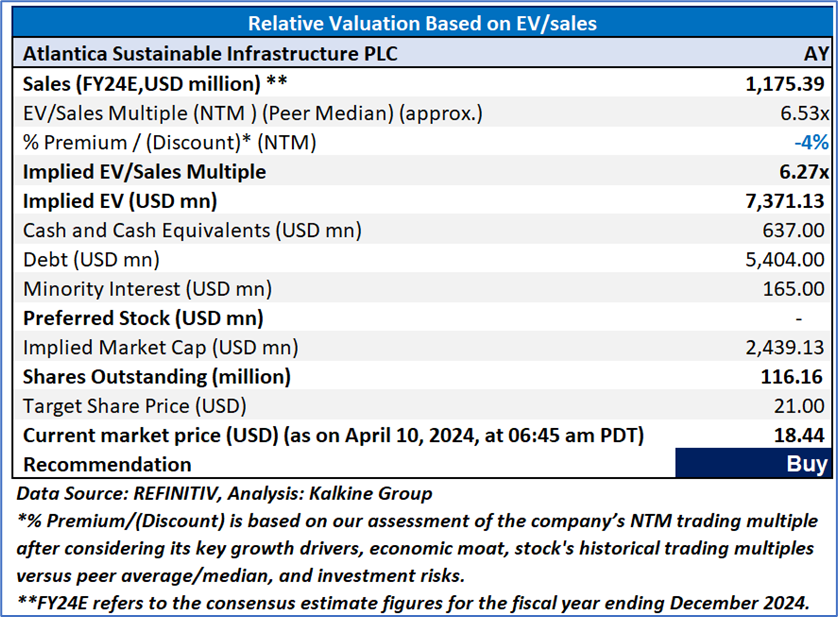
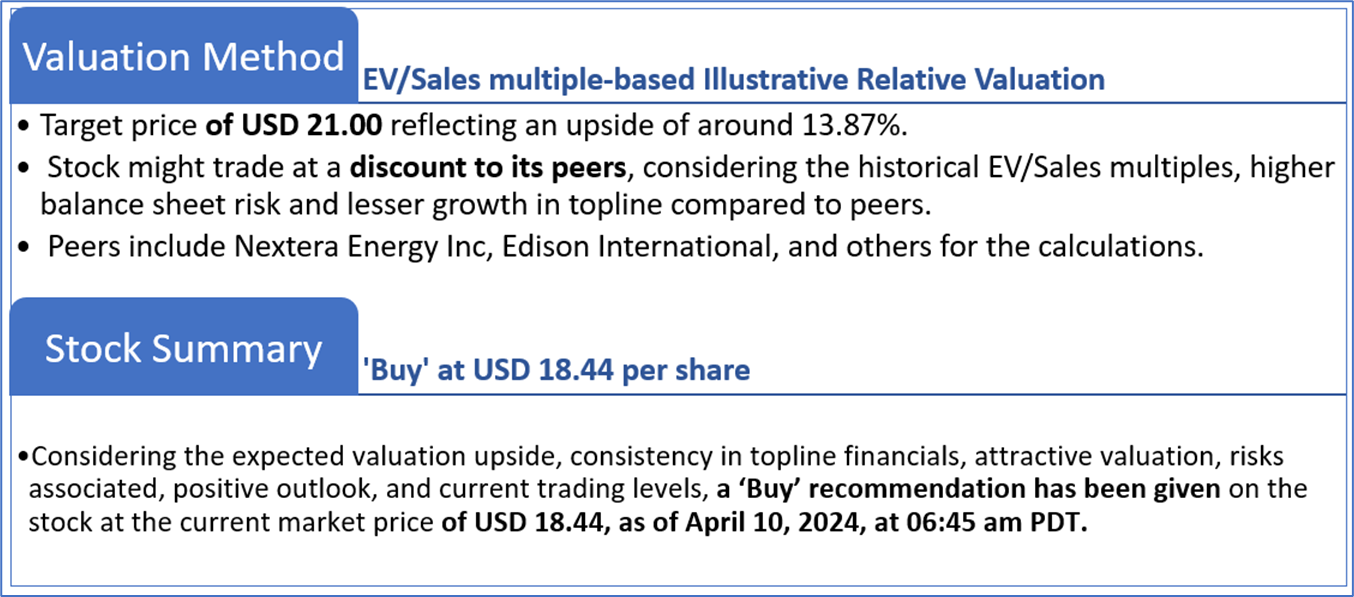
Markets are trading in a highly volatile zone currently due to certain macroeconomic issues and geopolitical tensions prevailing. Therefore, it is prudent to follow a cautious approach while investing.
Note 1: Past performance is not a reliable indicator of future performance.
Note 2: The reference date for all price data, currency, technical indicators, support, and resistance levels is April 10, 2024. The reference data in this report has been partly sourced from REFINITIV.
Note 3: Investment decisions should be made depending on an individual's appetite for upside potential, risks, holding duration, and any previous holdings. An 'Exit' from the stock can be considered if the Target Price mentioned as per the Valuation and or the technical levels provided has been achieved and is subject to the factors discussed above.
Note 4: The report publishing date is as per the Pacific Time Zone.
Technical Indicators Defined: -
Support: A level at which the stock prices tend to find support if they are falling, and a downtrend may take a pause backed by demand or buying interest. Support 1 refers to the nearby support level for the stock and if the price breaches the level, then Support 2 may act as the crucial support level for the stock.
Resistance: A level at which the stock prices tend to find resistance when they are rising, and an uptrend may take a pause due to profit booking or selling interest. Resistance 1 refers to the nearby resistance level for the stock and if the price surpasses the level, then Resistance 2 may act as the crucial resistance level for the stock.
Stop-loss: It is a level to protect against further losses in case of unfavorable movement in the stock prices.
References to ‘Kalkine’, ‘we’, ‘our’ and ‘us’ refer to Kalkine Limited.
This website is a service of Kalkine Limited. Kalkine Limited is a private limited company, incorporated in England and Wales with registration number 07903332. Kalkine Limited is authorised and regulated by the Financial Conduct Authority under reference number 579414.
The article has been prepared for informational purposes only and is not intended to be used as a complete source of information on any particular company. No advice or information, whether oral or written, obtained by you from Kalkine or through or from the service shall create any warranty not expressly stated. Kalkine does not intend to exclude any liability which it is not permitted to exclude under applicable law or regulation.
Kalkine does not offer financial advice based upon your personal financial situation or goals, and we shall NOT be held liable for any investment or trading losses you may incur by using the opinions expressed in our publications, market updates, news alerts and corporate profiles. Kalkine does not intend to exclude any liability which it is not permitted to exclude under applicable law or regulation. Kalkine’s non-personalised advice does not in any way endorse or recommend individuals, investment products or services for your personal financial situation. You should discuss your portfolios and the risk tolerance level appropriate for your personal financial situation, with a professional authorised financial planner and adviser. You should be aware that the value of any investment and the income from it can go down as well as up and you may not get back the amount invested.
Kalkine Media Limited, an affiliate of Kalkine Limited, may have received, or be entitled to receive, financial consideration in connection with providing information about certain entity(s) covered on its website.