
Kalkine’s Global Travel & Leisure Report offers a comprehensive view of the key companies and evolving trends across the travel value chain covering countries including US, Canada, Australia, UK, and New Zealand. This includes airlines, hospitality chains, digital travel platforms, as well as the rapidly growing leisure, entertainment, and gaming segments that are redefining the way people engage with travel experiences.

The Australian Casinos & Gaming industry is a cornerstone of the broader Travel & Leisure sector, encompassing a diverse ecosystem that includes land-based casinos, electronic gaming machines (EGMs), online wagering, sports betting, and B2B wagering technology platforms. This sector plays a crucial role in driving Australia’s GDP and tourism inflows, while operating under one of the most stringent regulatory environments globally governed by both federal and state frameworks.
According to IBISWorld (2024), Australia’s Casinos & Gaming industry recorded over AUD 8.5 billion in revenue in FY2024, with growth expected to continue at a moderate CAGR of 2.3% through FY2029, supported by the ongoing shift toward digital wagering and tempered by tightening regulatory oversight.

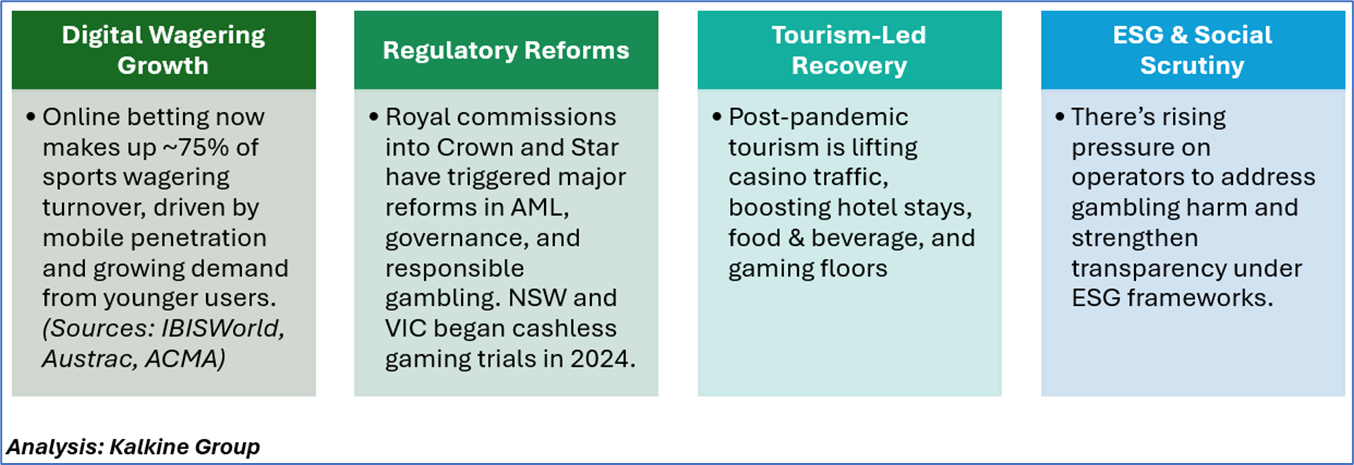

The Australian Casinos & Gaming industry is entering a stabilization phase recovering from reputational damage while embracing digital expansion. Growth will likely be driven by:
- Online platform enhancements
- International tourism return
- Tech-focused B2B models (e.g. BetMakers, Aristocrat)
Kalkine’s Global Travel & Leisure Report covers the Investment Highlights, Key Financial Metrics, Risks, Technical Analysis along with the Valuation, Target Price, and Recommendation on BetMakers Technology Group Ltd (ASX: BET).
Section 1: Company Overview and Fundamentals Insights
Company Overview: BetMakers Technology Group Ltd (ASX: BET) provides wagering technology, data, and analytics for B2B clients across key global markets. It operates through Global Betting Services and Global Tote, supporting racing bodies with content, platforms, and tote solutions. Kalkine’s Global Travel and Leisure Report covers the Investment Highlights, Key Financial Metrics, Risks, and Technical Analysis along with the Valuation, Target Price, and Recommendation on the stock.
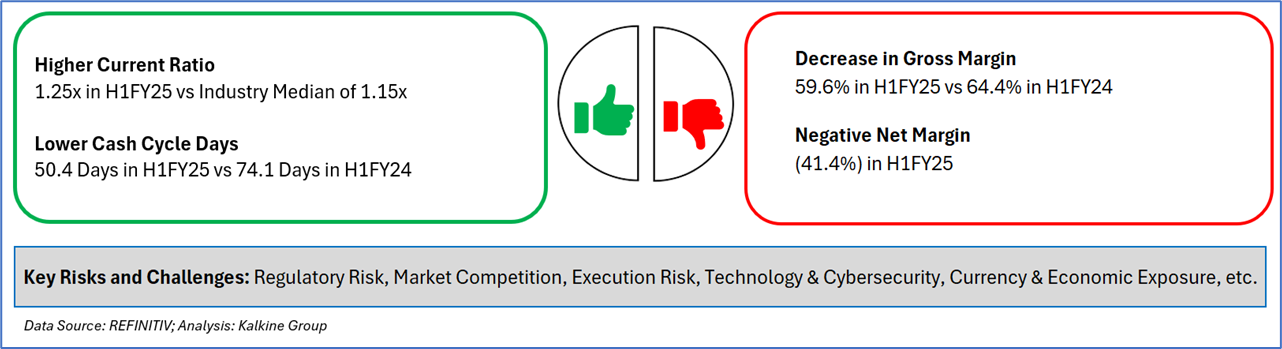
1.2 The Key Positives, Negatives, Investment Highlights, and Risks


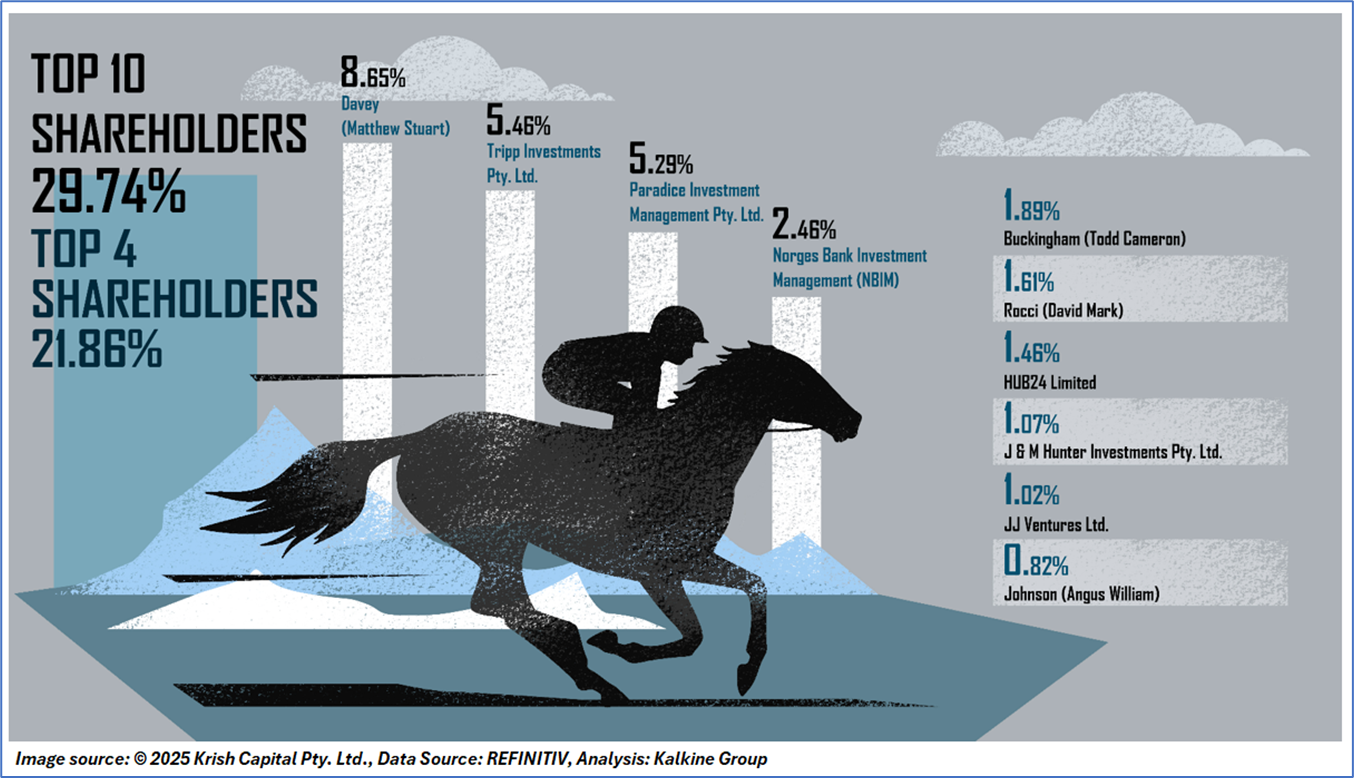
1.3 Top 10 Shareholders:
The top 10 shareholders together form ~29.74% of the total shareholding. Davey (Matthew Stuart), Tripp Investments Pty. Ltd. hold maximum stakes of 8.65% and 5.46%, respectively.
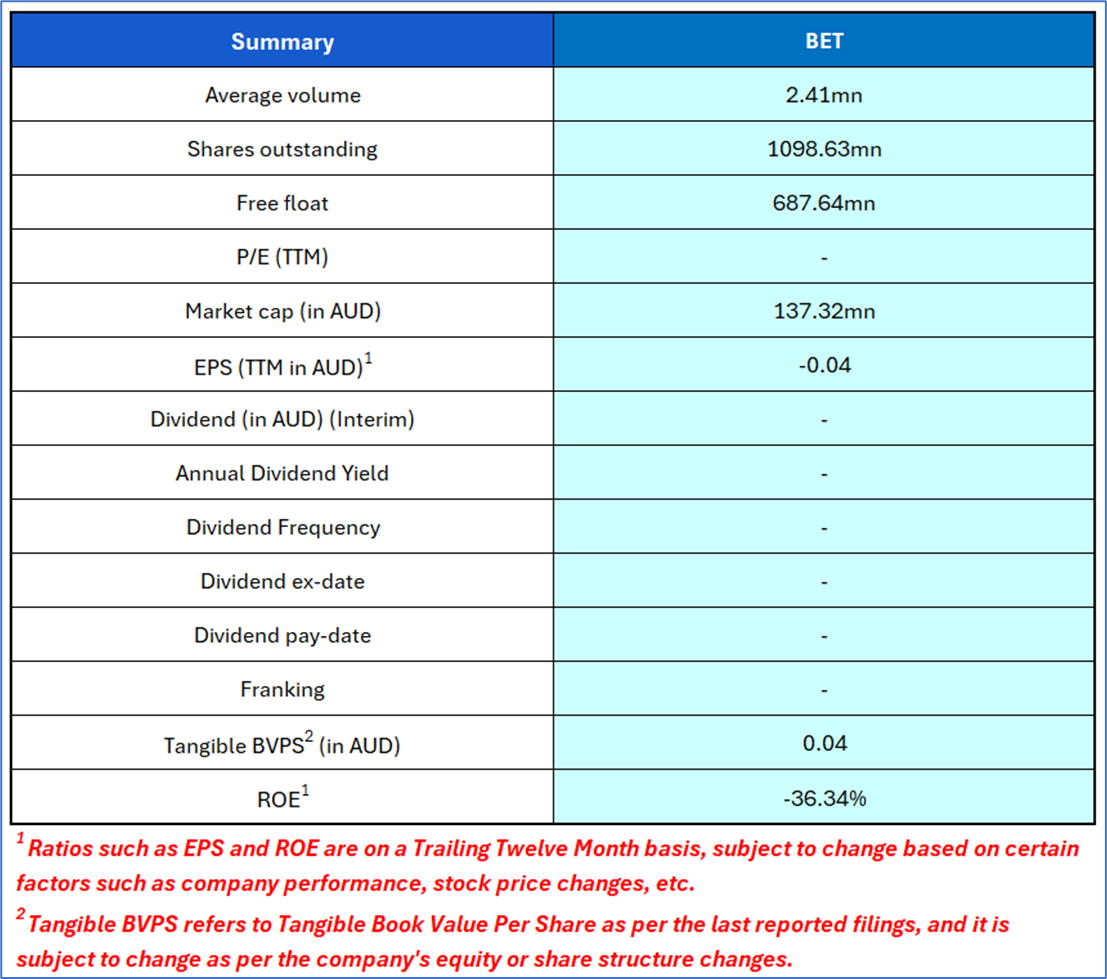
1.4 Key Metrics: BET’s cash cycle (days) decreased to 50.4 days in 1HFY25 compared to 74.1 days in 1HFY24. Below is captured other metrics:

Section 2: Business Updates, Financial and Operational Highlights
2.1 Recent Business Updates:

2.2 Q4FY25 Results Highlights (for the 03 months ended 30 June 2025): Below-mentioned are some key financial highlights:

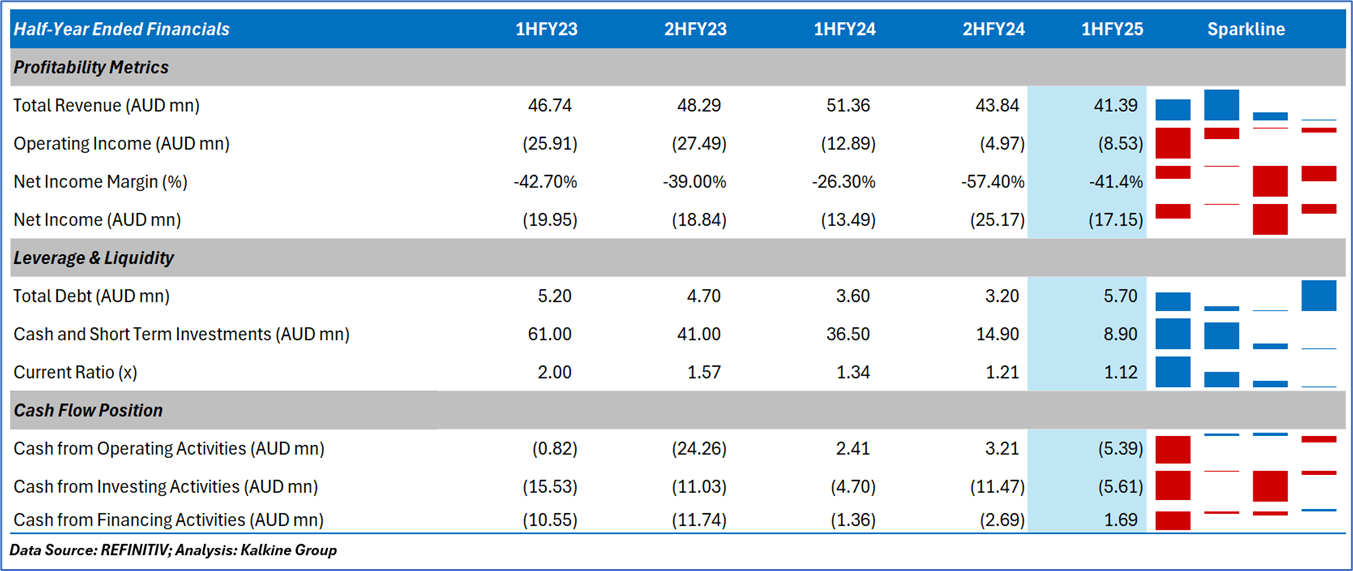
2.3 Historical Financial Trend
Section 3: Key Risks and Outlook:


Section 4: Stock Recommendation Summary
4.1 Price Performance and Technical Summary
The stock has increased by ~13.64% in the last three months, and over the past one year, stock has increased by ~38.89%. The stock has a 52-week low and 52-week high of AUD 0.076 and AUD 0.135, respectively, and is currently trading above the 52-week high-low average.


4.2 Fundamental Valuation
Valuation Methodology: EV/Sales Multiple Based Relative Valuation (Illustrative)


Markets are trading in a highly volatile zone currently due to certain macro-economic issues and geopolitical tensions prevailing. Therefore, it is prudent to follow a cautious approach while investing.
Note 1: Past performance is neither an indicator nor a guarantee of future performance.
Note 2: The reference date for all price data, currency, technical indicators, support, and resistance levels is 24 July 2025. The reference data in this report has been partly sourced from REFINITIV.
Note 3: Investment decisions should be made depending on an individual's appetite for upside potential, risks, holding duration, and any previous holdings. An 'Exit' from the stock can be considered if the Target Price mentioned as per the Valuation and or the technical levels provided has been achieved and is subject to the factors discussed above.
Note 4: Kalkine reports are prepared based on the stock prices captured either from REFINITIV or Trading View. Typically, REFINITIV or Trading View may reflect stock prices with a delay which could be a lag of 25-30 minutes. There can be no assurance that future results or events will be consistent with the information provided in the report. The information is subject to change without any prior notice.
Technical Indicators Defined: -
Support: A level at which the stock prices tend to find support if they are falling, and a downtrend may take a pause backed by demand or buying interest. Support 1 refers to the nearby support level for the stock and if the price breaches the level, then Support 2 may act as the crucial support level for the stock.
Resistance: A level at which the stock prices tend to find resistance when they are rising, and an uptrend may take a pause due to profit booking or selling interest. Resistance 1 refers to the nearby resistance level for the stock and if the price surpasses the level, then Resistance 2 may act as the crucial resistance level for the stock.
Stop-loss: It is a level to protect further losses in case of unfavourable movement in the stock prices.
Disclaimer-
This report has been issued by Kalkine Limited (Company number 07903332), a private limited company, incorporated in England and Wales ("Kalkine”). Kalkine.co.uk and associated pages are published by Kalkine. Kalkine is authorised and regulated by the Financial Conduct Authority under reference number 579414.
The information in this report and on the Kalkine website has been prepared from a wide variety of sources, which Kalkine, to the best of its knowledge and belief, considers accurate. Kalkine has made every effort to ensure the reliability of information contained in its reports, newsletters and websites. All information represents our views at the date of publication and may change without notice. The information in this report does not constitute an offer to sell securities or other financial products or a solicitation of an offer to buy securities or other financial products. Our reports contain non personalized recommendations to invest in securities and other financial products.
Kalkine does not offer financial advice based upon your personal financial situation or goals, and we shall not be held liable for any investment or trading losses you may incur by using the opinions expressed in our reports, publications, market updates, news alerts and corporate profiles. Kalkine does not intend to exclude any liability which it is not permitted to exclude under applicable law or regulation. Kalkine’s non-personalised advice does not in any way endorse or recommend individuals, investment products or services for your personal financial situation. You should discuss your portfolios and the risk tolerance level appropriate for your personal financial situation, with a professional authorised financial planner and adviser. You should be aware that the value of any investment and the income from it can go down as well as up and you may not get back the amount invested.
Please also read our Terms & Conditions for further information. Employees and/or associates of Kalkine and its related entities may hold interests in the securities or other financial products covered in this report or on the Kalkine website. Any such employees and associates are required to comply with certain safeguards, procedures and disclosures as required by law.
Kalkine Media Limited, an affiliate of Kalkine, may have received, or be entitled to receive, financial consideration in connection with providing information about certain entity(s) covered on its website including entities covered in this report.
Past performance is not a reliable indicator of future performance.

 Please wait processing your request...