Section 1: Company Overview and Fundamentals
1.1 Company Overview:
Blackstone Inc (NYSE: BX) is an alternative asset management firm that oversees a diverse range of investment strategies. Its portfolio includes global investments in areas such as real estate, private equity, infrastructure, life sciences, growth equity, credit, real assets, secondaries, and hedge funds. The company operates through four main business segments: Real Estate, Private Equity, Credit & Insurance, and Multi-Asset Investing.
Kalkine’s Diversified Opportunities Report covers the Company Overview, Key positives & negatives, Investment summary, Key investment metrics, Top 10 shareholding, Business updates and insights into company recent financial results, Key Risks & Outlook, Price performance and technical summary, Target Price, and Recommendation on the stock.
Stock Performance:
- The stock has given a return of 9.16% in the last one month, similarly a return of -19.55% in past six months.
- The 21-day MA has recently crossed above the 50-day MA, which is commonly referred to as a bullish crossover or a golden cross, often seen as a bullish signal indicating potential trend reversal or continuation of a rebound.
- The stock price is currently above both moving averages, supporting a short-term bullish bias.
- RSI is 58.27 approaching the 60 level, which is considered neutral to mildly bullish. It is still below the overbought threshold of 70, indicating there is room for further upside without being technically overbought.

1.2 The Key Positives, Negatives, and Investment summary


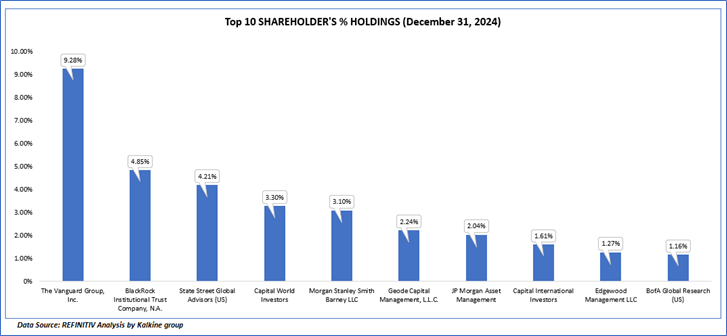
1.3 Top 10 shareholders:
The top 10 shareholders together form ~33.05% of the total shareholding, signifying concentrated shareholding. The Vanguard Group, Inc. and BlackRock Institutional Trust Company, N.A. are the biggest shareholders, holding the maximum stake in the company at 9.28% and 4.85%, respectively.
1.4 Key Metrics:
The chart shows a decline in profitability metrics for Q1 FY25 compared to Q1 FY24 across all key indicators. The EBITDA margin dropped from 56.8% to 47.5%, and the operating margin declined from 51.5% to 42.4%, indicating higher operating costs or weaker revenue leverage. Similarly, the income before tax margin fell from 51.0% to 44.2%, and although the income tax rate slightly increased (from 15.1% to 16.8%), the overall net margin still declined from 43.3% to 36.7%. These trends suggest deterioration in cost efficiency or lower revenue quality, ultimately leading to reduced profitability year-over-year.

Section 2: Business Updates and Corporate Business Highlights
2.1 Recent Updates:
The below picture gives an overview of the recent updates:

2.2 Insights of Q1FY25:

Section 3: Key Risks & Outlook

Section 4: Stock Recommendation Summary:
4.1 Price Performance and Technical Summary:
Stock Performance:
Blackstone (BX) is showing early signs of a bullish reversal after a prolonged downtrend. The stock is trading above both its 21-day and 50-day moving averages, with a recent bullish crossover suggesting upward momentum. RSI is at 58.27, indicating strengthening but not overbought conditions. Increased volume during the recent rally supports the move.


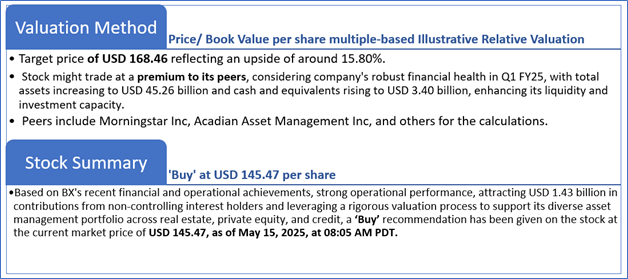
4.2 Fundamental Valuation
Valuation Methodology: Price/Book Value per share Multiple Based Relative Valuation

Markets are trading in a highly volatile zone currently due to certain macroeconomic issues and geopolitical tensions prevailing. Therefore, it is prudent to follow a cautious approach while investing.
Note 1: Past performance is not a reliable indicator of future performance.
Note 2: The reference date for all price data, currency, technical indicators, support, and resistance levels is May 15, 2025. The reference data in this report has been partly sourced from REFINITIV.
Note 3: Investment decisions should be made depending on an individual's appetite for upside potential, risks, holding duration, and any previous holdings. An 'Exit' from the stock can be considered if the Target Price mentioned as per the Valuation and or the technical levels provided has been achieved and is subject to the factors discussed above.
Note 4: The report publishing date is as per the Pacific Time Zone.
Technical Indicators Defined: -
Support: A level at which the stock prices tend to find support if they are falling, and a downtrend may take a pause backed by demand or buying interest. Support 1 refers to the nearby support level for the stock and if the price breaches the level, then Support 2 may act as the crucial support level for the stock.
Resistance: A level at which the stock prices tend to find resistance when they are rising, and an uptrend may take a pause due to profit booking or selling interest. Resistance 1 refers to the nearby resistance level for the stock and if the price surpasses the level, then Resistance 2 may act as the crucial resistance level for the stock.
Stop-loss: It is a level to protect against further losses in case of unfavorable movement in the stock prices.
Disclaimer-
This report has been issued by Kalkine Limited (Company number 07903332), a private limited company, incorporated in England and Wales ("Kalkine”). Kalkine.co.uk and associated pages are published by Kalkine. Kalkine is authorised and regulated by the Financial Conduct Authority under reference number 579414.
The information in this report and on the Kalkine website has been prepared from a wide variety of sources, which Kalkine, to the best of its knowledge and belief, considers accurate. Kalkine has made every effort to ensure the reliability of information contained in its reports, newsletters and websites. All information represents our views at the date of publication and may change without notice. The information in this report does not constitute an offer to sell securities or other financial products or a solicitation of an offer to buy securities or other financial products. Our reports contain non personalized recommendations to invest in securities and other financial products.
Kalkine does not offer financial advice based upon your personal financial situation or goals, and we shall not be held liable for any investment or trading losses you may incur by using the opinions expressed in our reports, publications, market updates, news alerts and corporate profiles. Kalkine does not intend to exclude any liability which it is not permitted to exclude under applicable law or regulation. Kalkine’s non-personalised advice does not in any way endorse or recommend individuals, investment products or services for your personal financial situation. You should discuss your portfolios and the risk tolerance level appropriate for your personal financial situation, with a professional authorised financial planner and adviser. You should be aware that the value of any investment and the income from it can go down as well as up and you may not get back the amount invested.
Please also read our Terms & Conditions for further information. Employees and/or associates of Kalkine and its related entities may hold interests in the securities or other financial products covered in this report or on the Kalkine website. Any such employees and associates are required to comply with certain safeguards, procedures and disclosures as required by law.
Kalkine Media Limited, an affiliate of Kalkine, may have received, or be entitled to receive, financial consideration in connection with providing information about certain entity(s) covered on its website including entities covered in this report.
Past performance is not a reliable indicator of future performance.

 Please wait processing your request...