Section 1: Company Overview and Fundamentals
1.1 Company Overview:
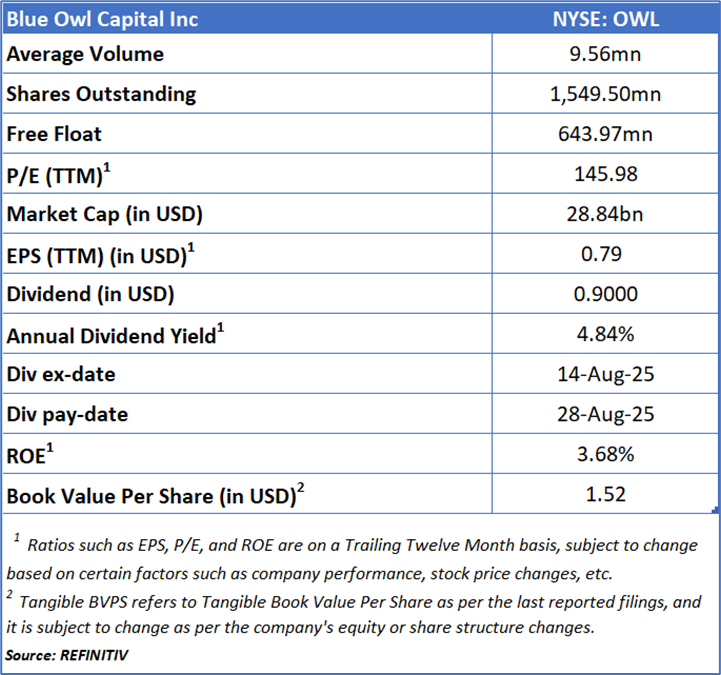
Blue Owl Capital Inc (NYSE: OWL) is an alternative asset manager that invests private capital across its Credit, GP Strategic Capital, and Real Estate platforms, serving both institutional investors and private wealth clients. Its offerings span these three core product areas.
Kalkine’s Diversified Opportunities Report covers the Company Overview, Key positives & negatives, Investment summary, Key investment metrics, Top 10 shareholding, Business updates and insights into company recent financial results, Key Risks & Outlook, Price performance and technical summary, Target Price, and Recommendation on the stock.
Stock Performance:
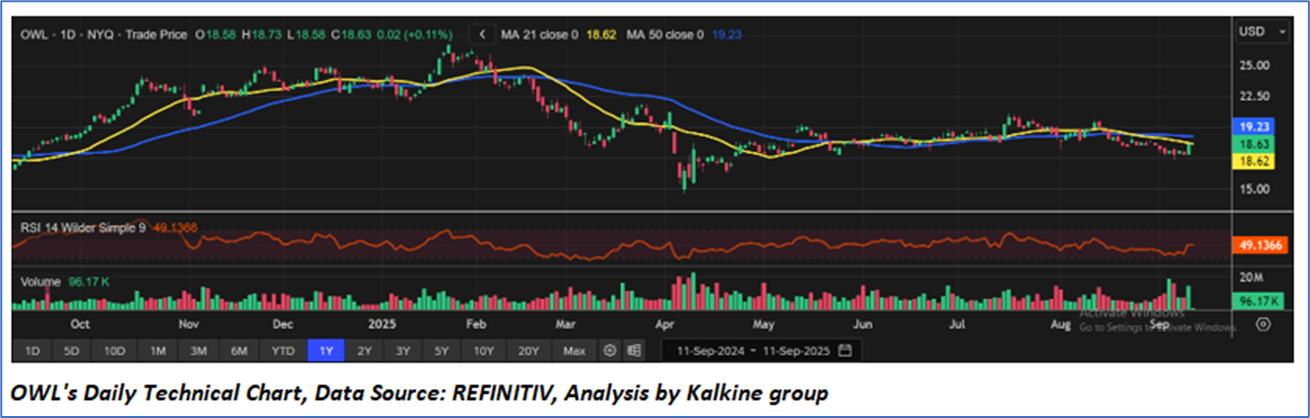
- Volume on the recent up day (14.36M) is relatively high, suggesting some accumulation or short covering. Sustained volume above average on up days would strengthen a bullish case.
- Price is slightly above short-term average (21-Day MA of USD 18.62), indicating a near-term bullish sign. The 21-day MA crossed below the 50-day MA earlier (bearish crossover), signaling medium-term weakness. Until a bullish crossover occurs, the trend bias remains cautious. Moreover, the price remains below the 50-day MA, which may act as resistance. Sustained movement above this level would indicate a trend reversal attempt.
- Current RSI: ~49.14 – neutral zone. The RSI has been trending sideways since mid-July, showing lack of strong momentum. A move above 55–60 could confirm a shift to bullish momentum.
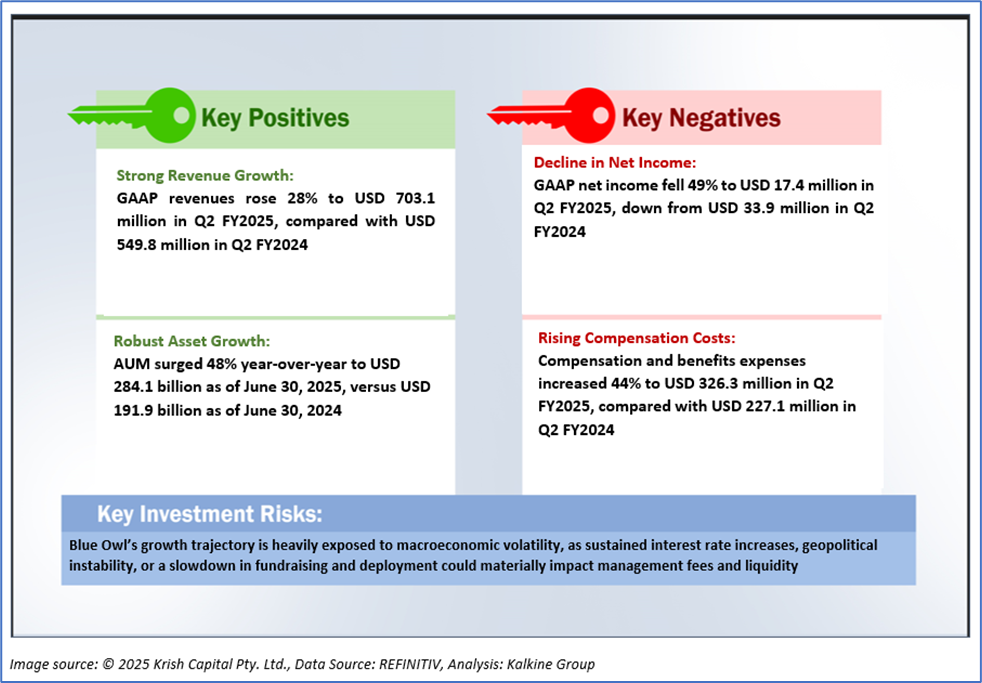
1.2 The Key Positives, Negatives, and Investment summary
1.3 Top 10 shareholders:
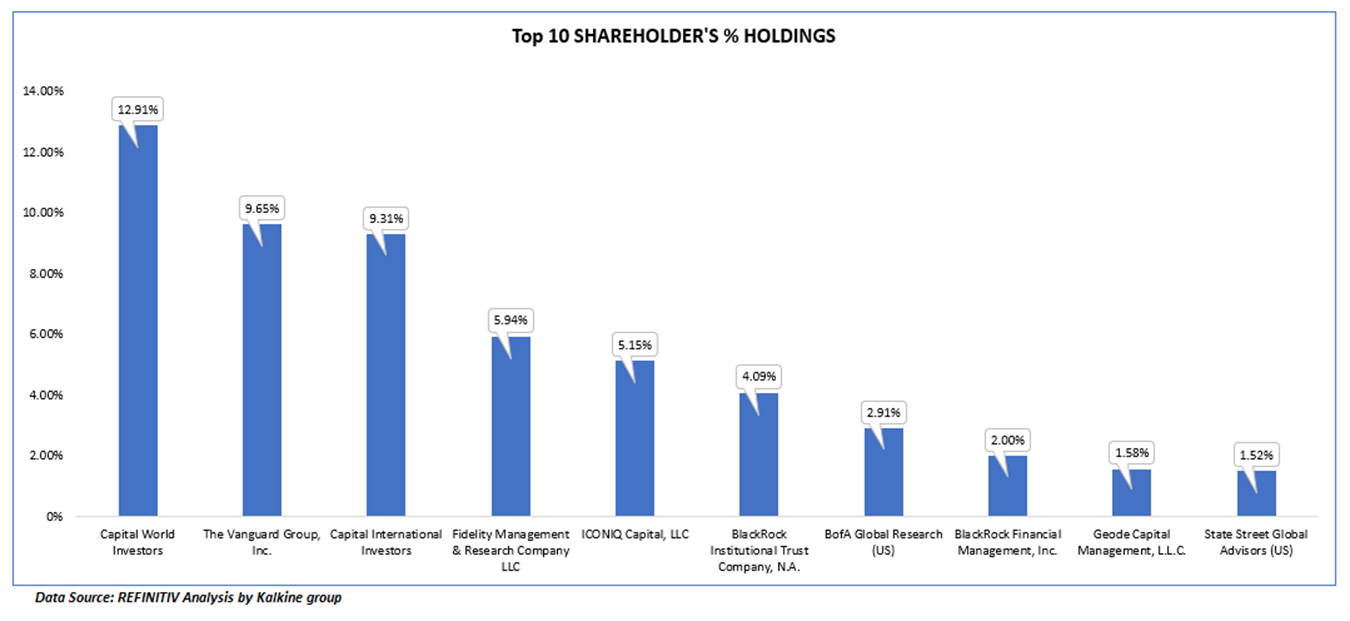
The top 10 shareholders together form ~ 55.04% of the total shareholding, signifying concentrated shareholding. Capital World Investors and The Vanguard Group, Inc. are the biggest shareholders, holding the maximum stake in the company at 12.91% and 9.65%, respectively.
1.4 Key Metrics:
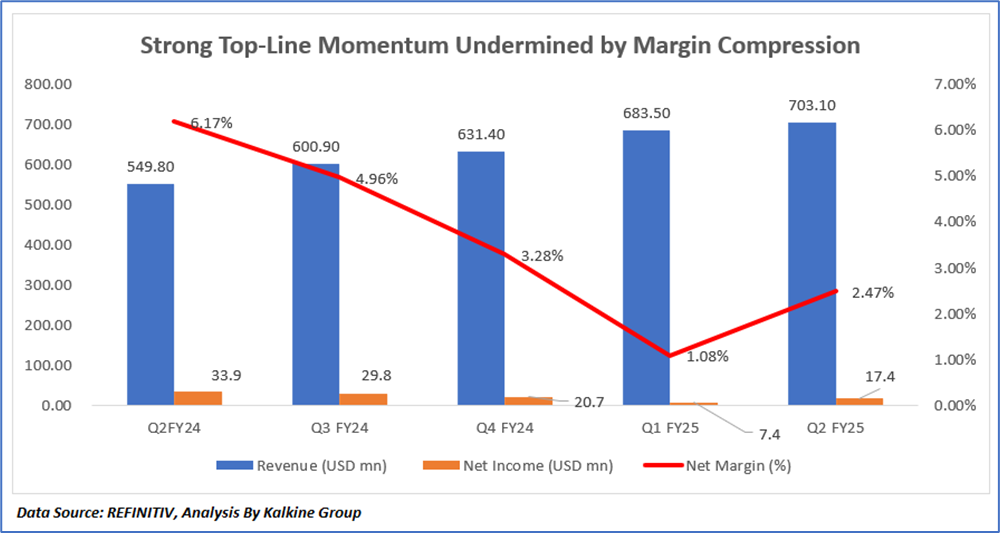
In the second quarter of 2025 Blue Owl showcased steady revenue growth from Q2 FY24 to Q2 FY25, supported by strong fundraising, acquisitions, and higher management fees, but net income and margins declined due to sharply higher expenses, including a 44% rise in compensation, increased amortization, and acquisition-related costs. As a result, net margin fell from 6.2% in Q2 FY24 to just 1.1% in Q1 FY25, before modestly recovering to 2.5% in Q2 FY25.
Section 2: Business Updates and Corporate Business Highlights
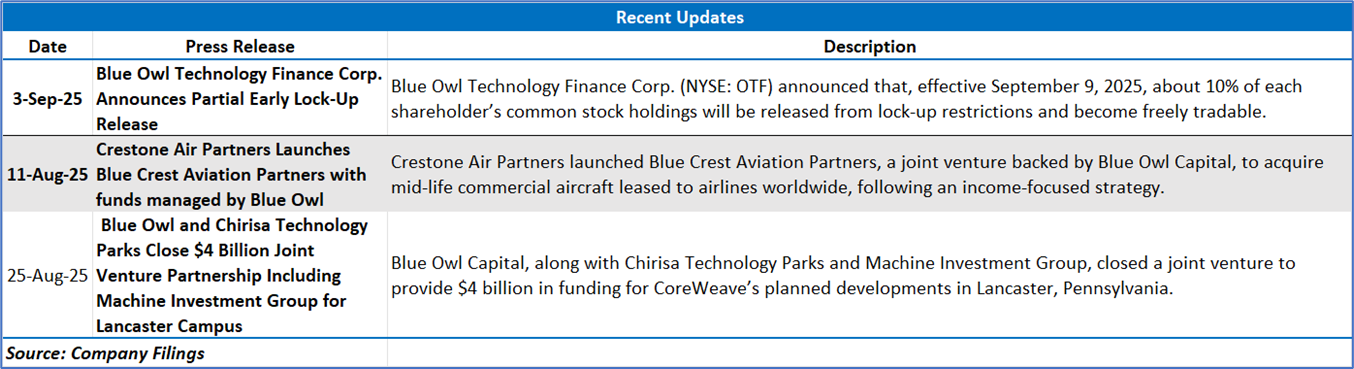
2.1 Recent Business Updates
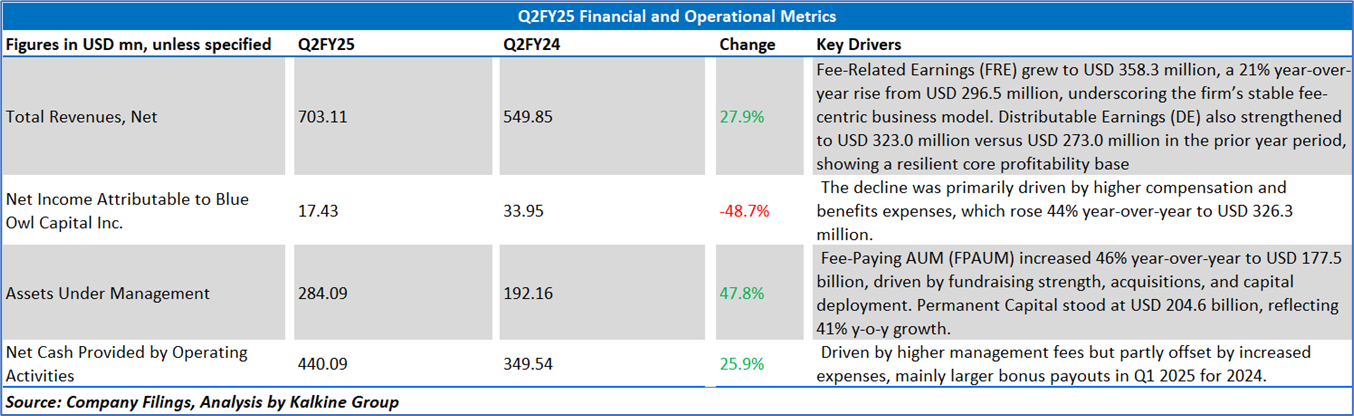
2.2 Insights of Q2FY25:
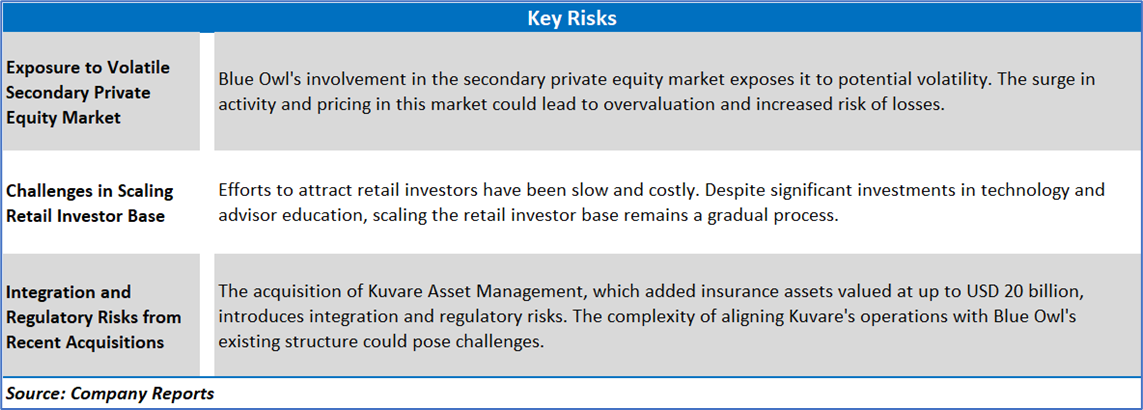
Section 3: Key Risks & Outlook
Section 4: Stock Recommendation Summary:
4.1 Price Performance and Technical Summary:
Stock Performance:
- Volume on the recent up day (14.36M) is relatively high, suggesting some accumulation or short covering. Sustained volume above average on up days would strengthen a bullish case.
- Price is slightly above short-term average (21-Day MA of USD 18.62), indicating a near-term bullish sign. The 21-day MA crossed below the 50-day MA earlier (bearish crossover), signaling medium-term weakness. Until a bullish crossover occurs, the trend bias remains cautious. Moreover, the price remains below the 50-day MA, which may act as resistance. Sustained movement above this level would indicate a trend reversal attempt.
- Current RSI: ~49.14 – neutral zone. The RSI has been trending sideways since mid-July, showing lack of strong momentum. A move above 55–60 could confirm a shift to bullish momentum.
4.2 Fundamental Valuation
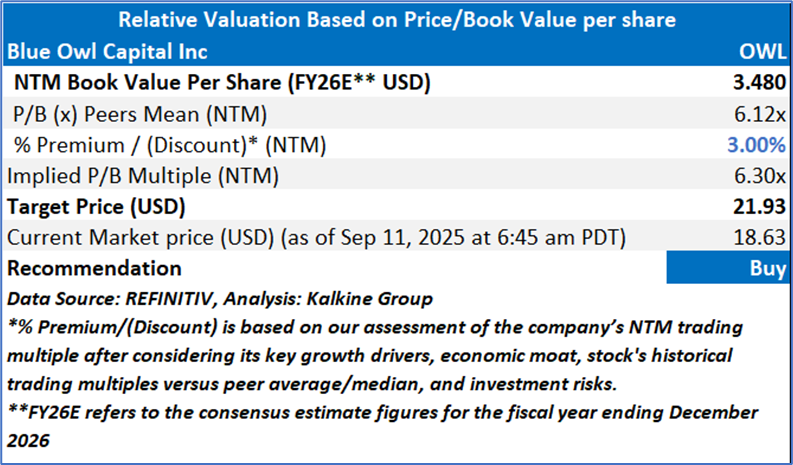
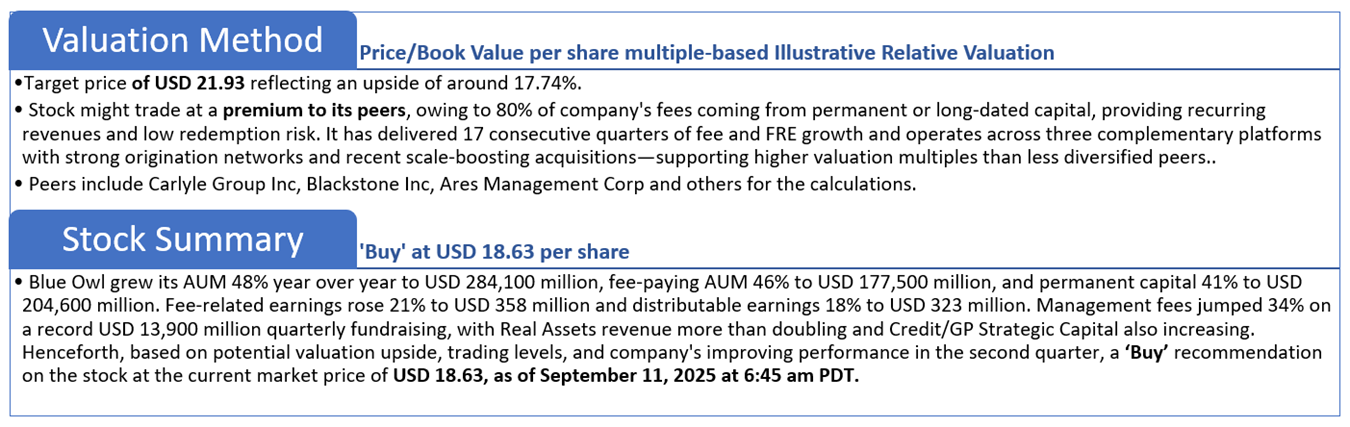
Valuation Methodology: Price/Book Value per share Multiple Based Relative Valuation
Markets are trading in a highly volatile zone currently due to certain macroeconomic issues and geopolitical tensions prevailing. Therefore, it is prudent to follow a cautious approach while investing.
Note 1: Past performance is not a reliable indicator of future performance.
Note 2: The reference date for all price data, currency, technical indicators, support, and resistance levels is September 11, 2025. The reference data in this report has been partly sourced from REFINITIV.
Note 3: Investment decisions should be made depending on an individual's appetite for upside potential, risks, holding duration, and any previous holdings. An 'Exit' from the stock can be considered if the Target Price mentioned as per the Valuation and or the technical levels provided has been achieved and is subject to the factors discussed above.
Note 4: The report publishing date is as per the Pacific Time Zone.
Technical Indicators Defined: -
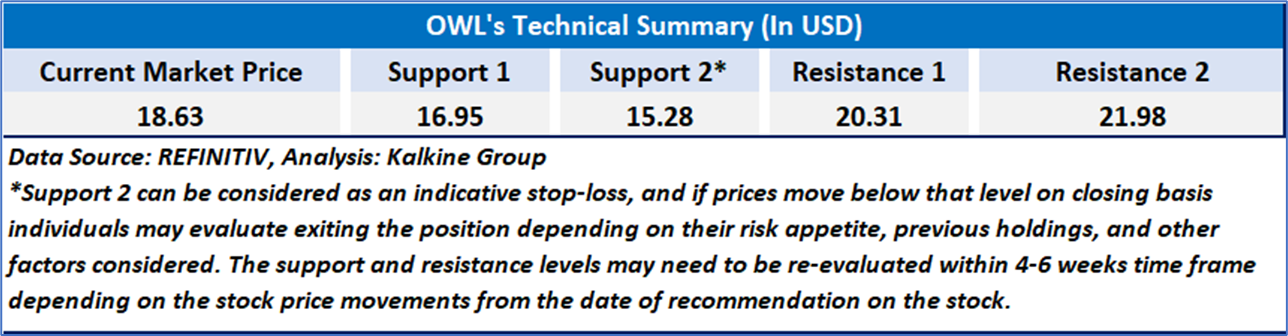
Support: A level at which the stock prices tend to find support if they are falling, and a downtrend may take a pause backed by demand or buying interest. Support 1 refers to the nearby support level for the stock and if the price breaches the level, then Support 2 may act as the crucial support level for the stock.
Resistance: A level at which the stock prices tend to find resistance when they are rising, and an uptrend may take a pause due to profit booking or selling interest. Resistance 1 refers to the nearby resistance level for the stock and if the price surpasses the level, then Resistance 2 may act as the crucial resistance level for the stock.
Stop-loss: It is a level to protect against further losses in case of unfavorable movement in the stock prices.
Disclaimer-
This report has been issued by Kalkine Limited (Company number 07903332), a private limited company, incorporated in England and Wales ("Kalkine”). Kalkine.co.uk and associated pages are published by Kalkine. Kalkine is authorised and regulated by the Financial Conduct Authority under reference number 579414.
The information in this report and on the Kalkine website has been prepared from a wide variety of sources, which Kalkine, to the best of its knowledge and belief, considers accurate. Kalkine has made every effort to ensure the reliability of information contained in its reports, newsletters and websites. All information represents our views at the date of publication and may change without notice. The information in this report does not constitute an offer to sell securities or other financial products or a solicitation of an offer to buy securities or other financial products. Our reports contain non personalized recommendations to invest in securities and other financial products.
Kalkine does not offer financial advice based upon your personal financial situation or goals, and we shall not be held liable for any investment or trading losses you may incur by using the opinions expressed in our reports, publications, market updates, news alerts and corporate profiles. Kalkine does not intend to exclude any liability which it is not permitted to exclude under applicable law or regulation. Kalkine’s non-personalised advice does not in any way endorse or recommend individuals, investment products or services for your personal financial situation. You should discuss your portfolios and the risk tolerance level appropriate for your personal financial situation, with a professional authorised financial planner and adviser. You should be aware that the value of any investment and the income from it can go down as well as up and you may not get back the amount invested.
Please also read our Terms & Conditions for further information. Employees and/or associates of Kalkine and its related entities may hold interests in the securities or other financial products covered in this report or on the Kalkine website. Any such employees and associates are required to comply with certain safeguards, procedures and disclosures as required by law.
Kalkine Media Limited, an affiliate of Kalkine, may have received, or be entitled to receive, financial consideration in connection with providing information about certain entity(s) covered on its website including entities covered in this report.
Past performance is not a reliable indicator of future performance.

 Please wait processing your request...