
This report is an updated version of the report published on 10 April 2024 at 08:50 AM GMT+1.
Section 1: Company Overview and Fundamental Insights
1.1 Company Overview:
BP PLC (LSE: BP.) is an FTSE 100-listed multinational oil and gas company with a global energy business spread across Australasia, Asia, Africa, Europe, North and South America. Kalkine’s Resources Report covers the Investment Highlights, Key Financial Metrics, Risks, and Recent Business Updates along with the Valuation, Target Price, and Recommendation on the stock.
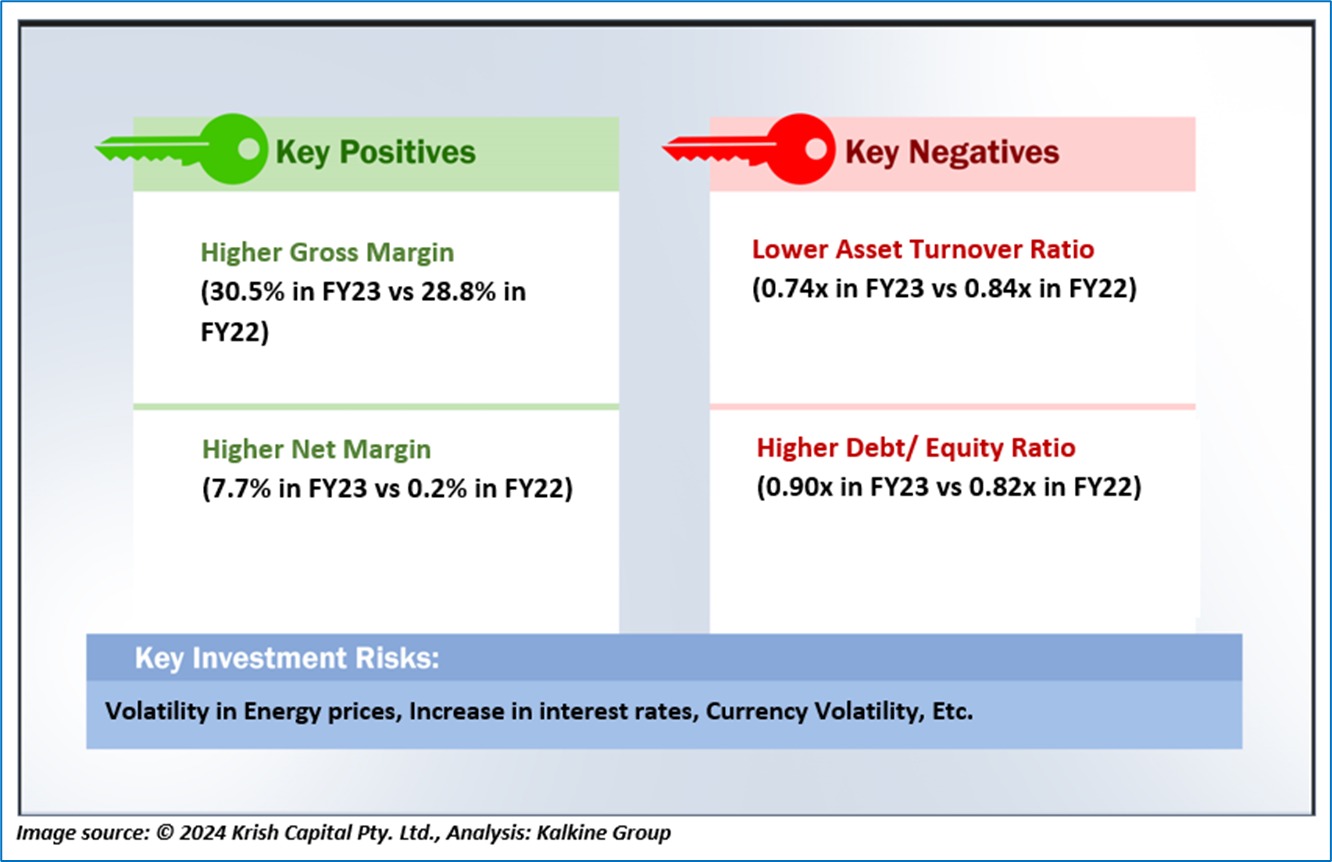
1.2 The Key Positives, Negatives, Highlights and Risks
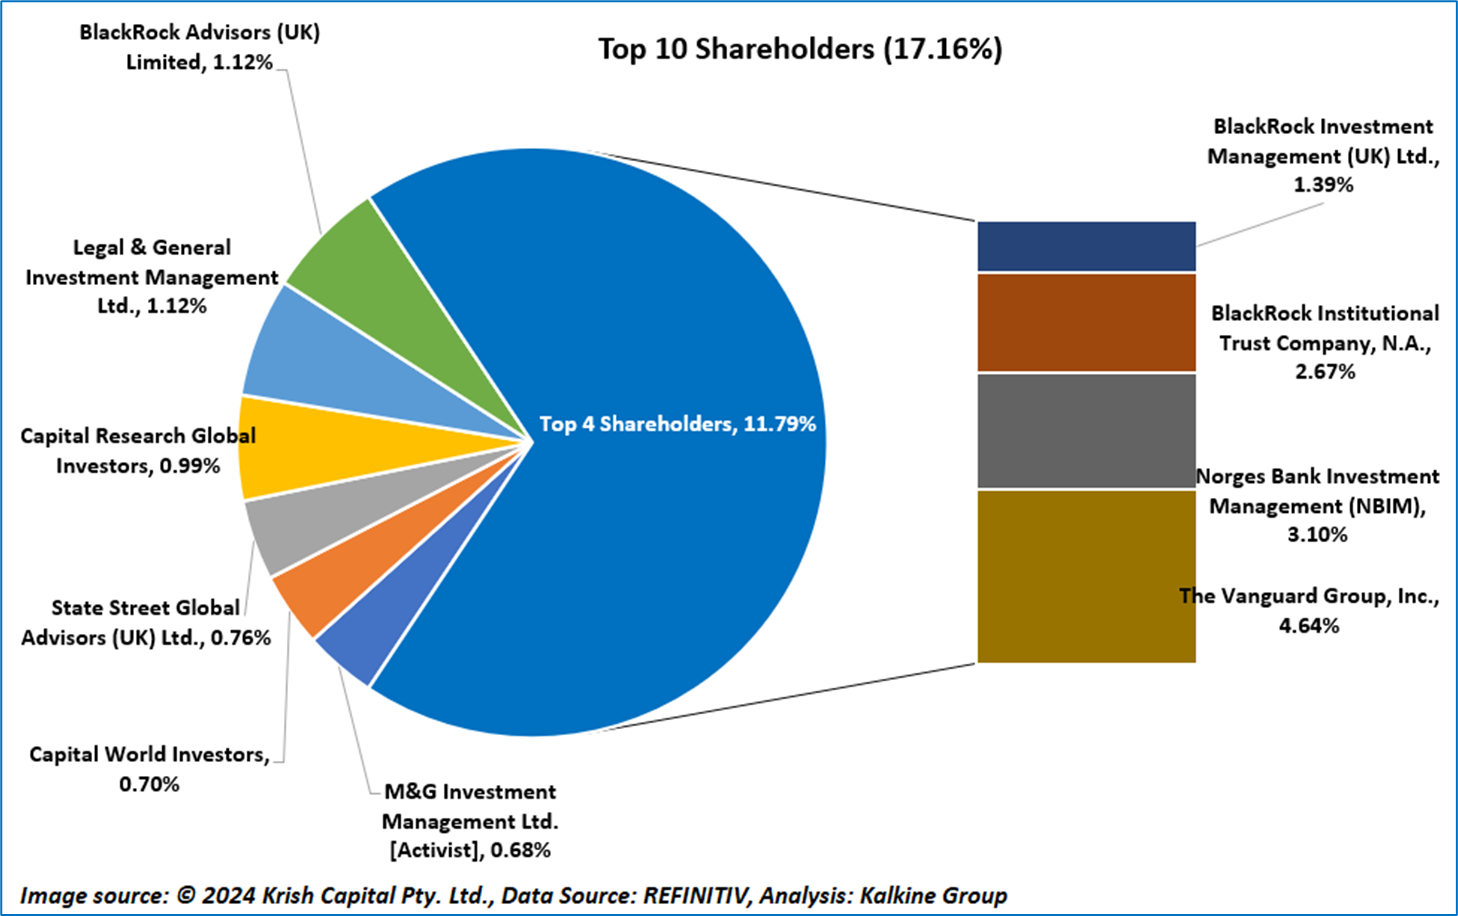
1.3 Top 10 Shareholders:
The top 10 shareholders collectively form ~17.16% of the total shareholdings. The Vanguard Group, Inc. holds the maximum number of shares with ~4.64% shareholding, followed by Norges Bank Investment Management (NBIM) with ~3.10% shareholding, as depicted in the chart below:
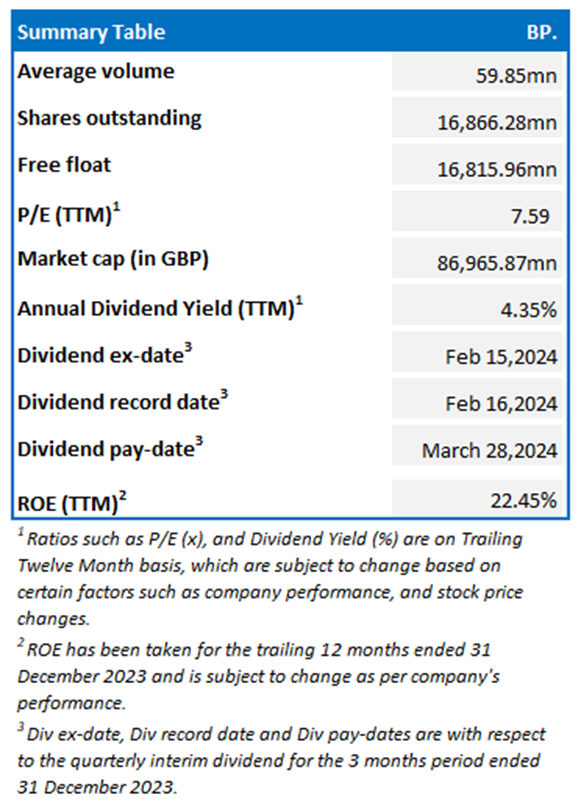
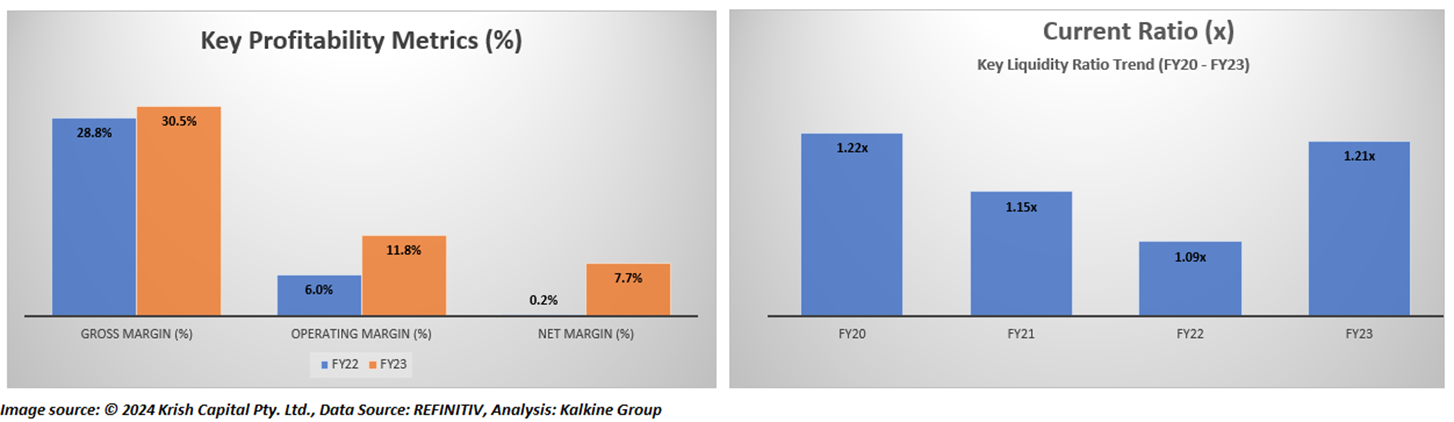
1.4 Key Metrics:
Section 2: Business Updates and Financial Highlights
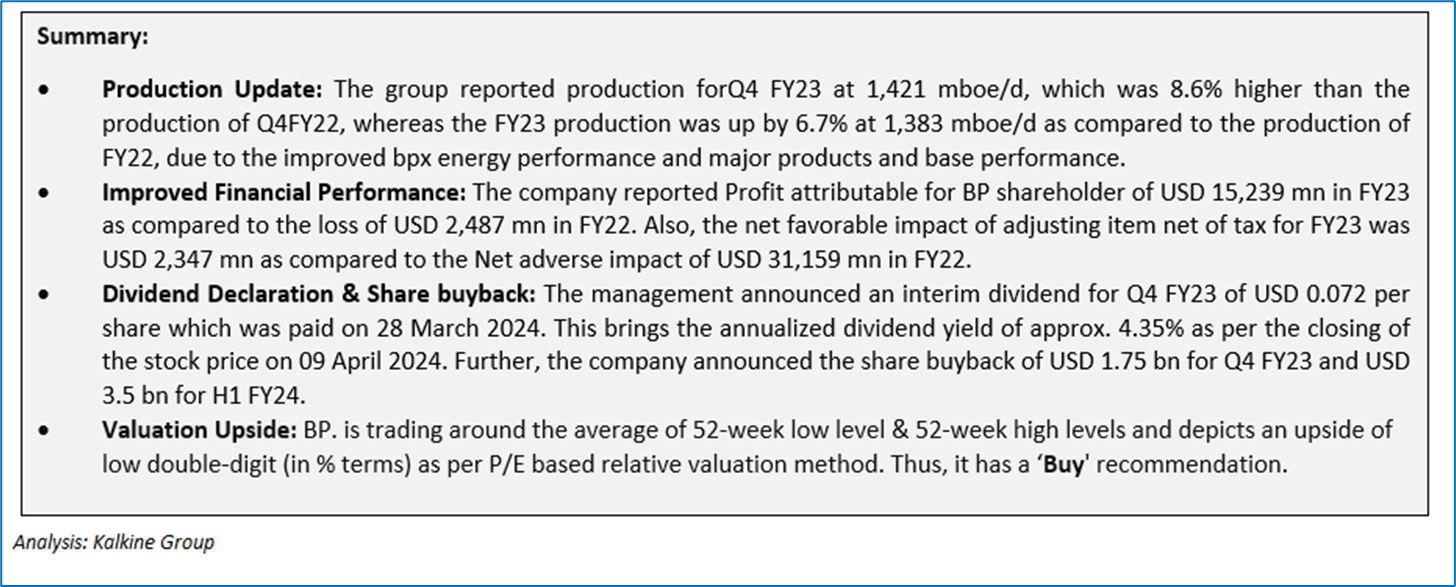
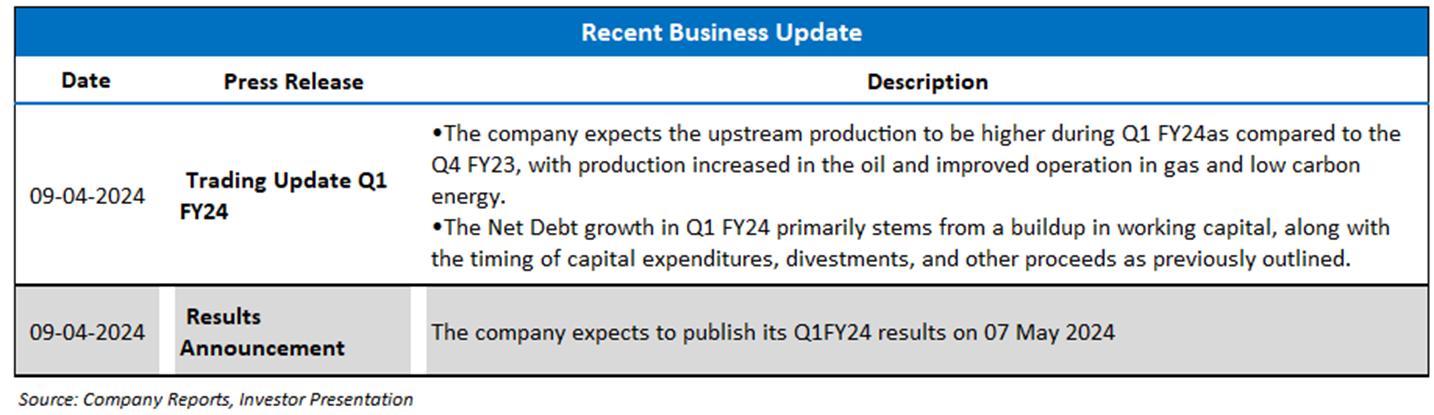
2.1 Recent Business Updates
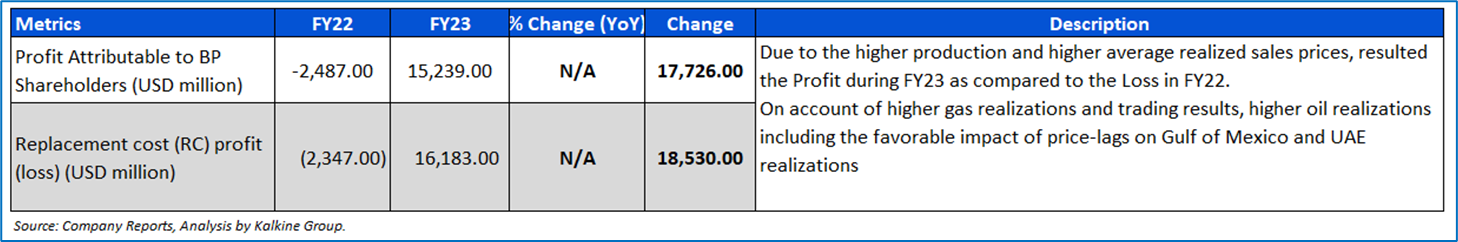
2.2 Financial Highlights:
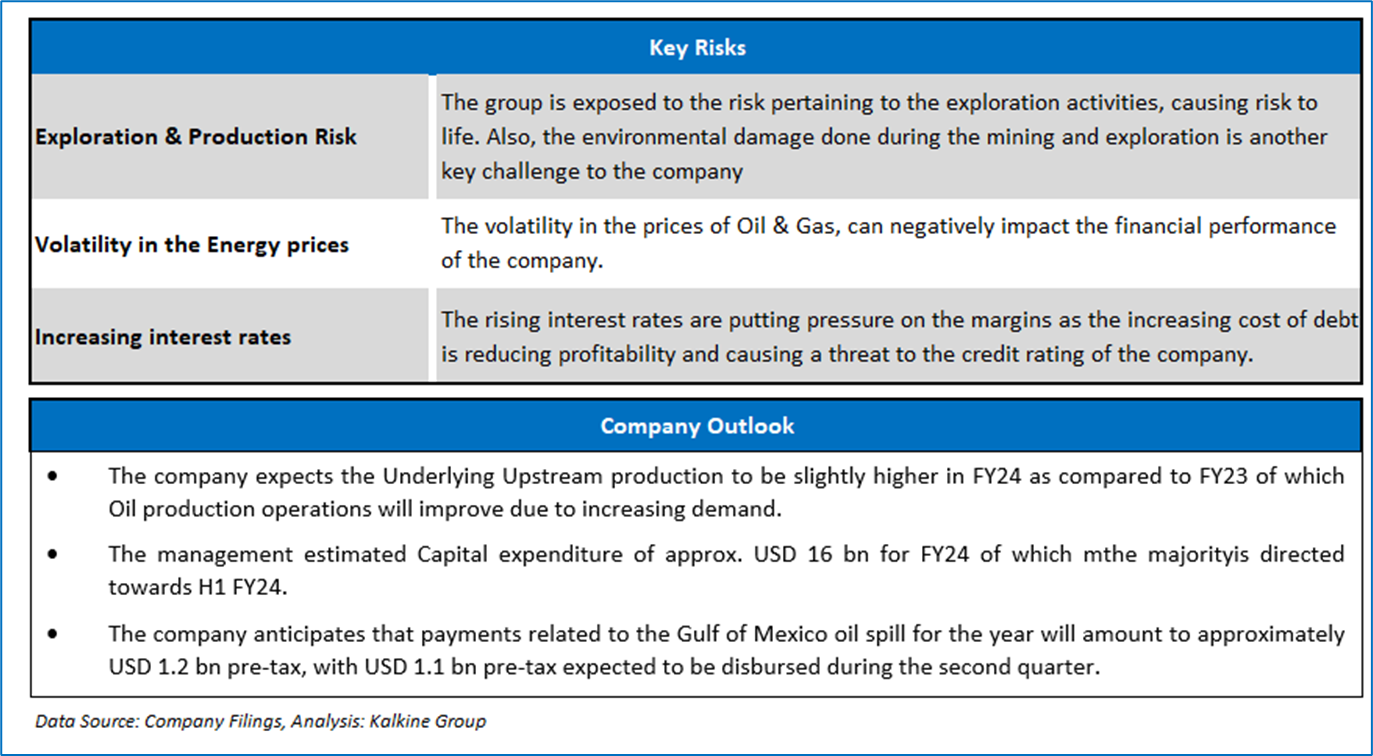
Section 3: Key Risks and Outlook
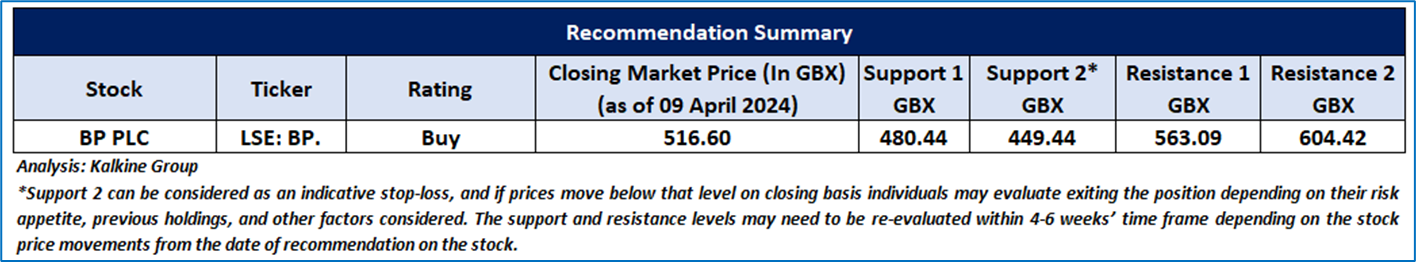
Section 4: Stock Recommendation Summary
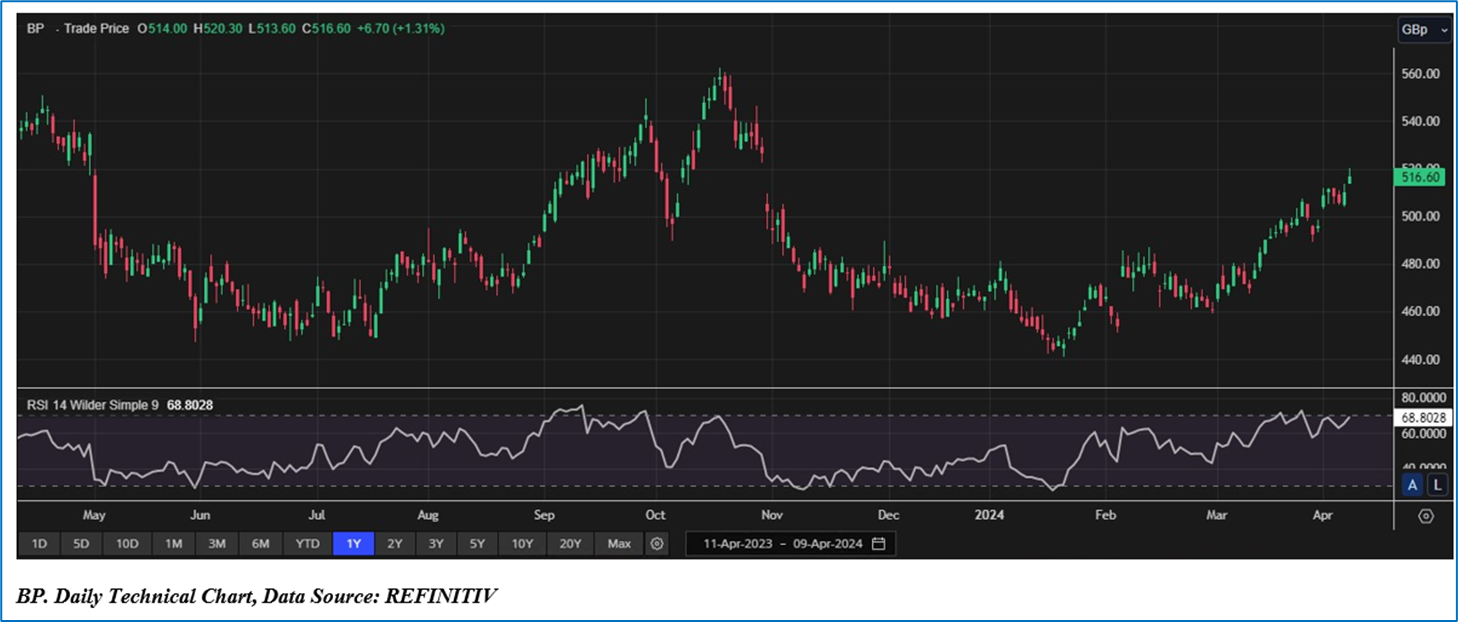
4.1 Price Performance and Technical Summary:
The stock has witnessed a rise of ~12.46% in the last three months and over the last six months, it has slipped by ~1.61%. The stock has a 52-week low and 52-week high of GBX 441.05 & 562.30, respectively and is currently trading above the average of 52-week high-low.
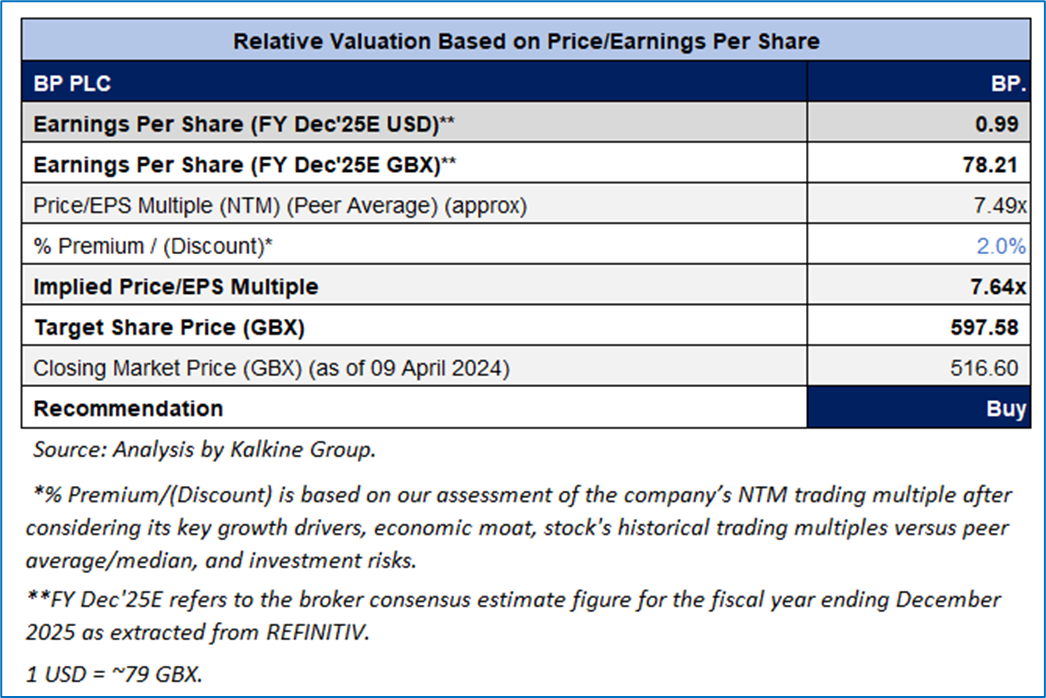
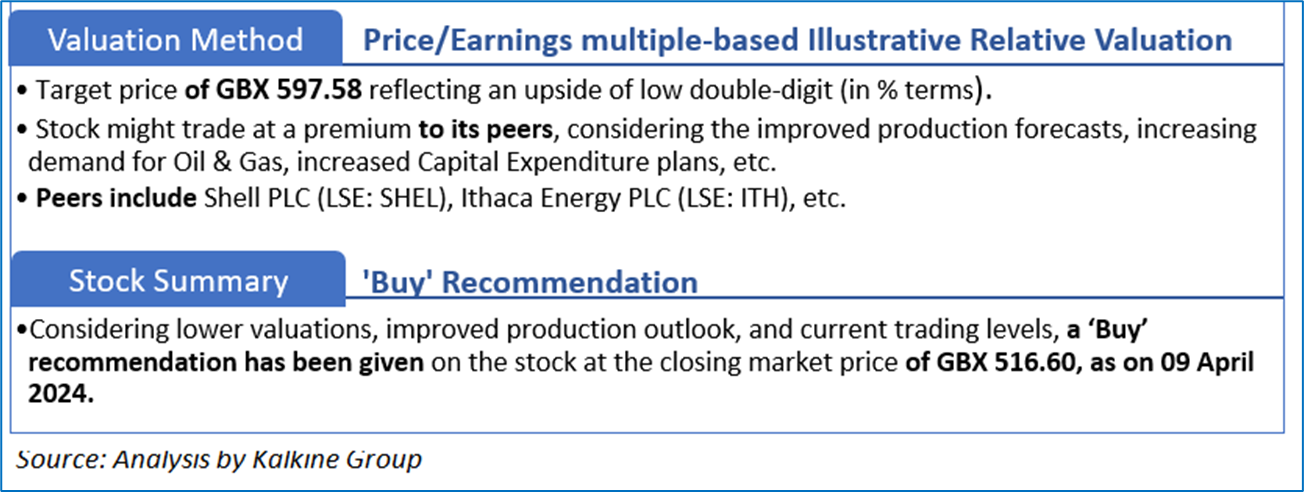
4.2 Fundamental Valuation
Valuation Methodology: Price/Earnings Approach
Please note markets are trading in a highly volatile zone currently due to certain macro-economic and geopolitical tensions prevailing. Therefore, it is prudent to follow a cautious approach while investing.
Note 1: Past performance is not a reliable indicator of future performance.
Note 2: The reference data for all price data, currency, technical indicators, support, and resistance levels is 09 April 2024. The reference data in this report has been partly sourced from REFINITIV.
Note 3: Investment decisions should be made depending on an individual's appetite for upside potential, risks, holding duration, and any previous holdings. An 'Exit' from the stock can be considered if the Target Price mentioned as per the Valuation and or the technical levels provided has been achieved and is subject to the factors discussed above.
Note 4: Target Price refers to a price level that the stock is expected to reach as per the relative valuation method and or technical analysis taking into consideration both short-term and long-term scenarios.
Note 5: Kalkine reports are prepared based on the stock prices captured either from the London Stock Exchange (LSE) and or REFINITIV. Typically, both sources (LSE and or REFINITIV) may reflect stock prices with a delay which could be a lag of 15-20 minutes. There can be no assurance that future results or events will be consistent with the information provided in the report. The information is subject to change without any prior notice.
Note 6: Dividend Yield may vary as per the stock price movement.
Technical Indicators Defined: -
Support: A level at which the stock prices tend to find support if they are falling, and a downtrend may take a pause backed by demand or buying interest. Support 1 refers to the nearby support level for the stock and if the price breaches the level, then Support 2 may act as the crucial support level for the stock.
Resistance: A level at which the stock prices tend to find resistance when they are rising, and an uptrend may take a pause due to profit booking or selling interest. Resistance 1 refers to the nearby resistance level for the stock and if the price surpasses the level, then Resistance 2 may act as the crucial resistance level for the stock.
Stop-loss: It is a level to protect further losses in case of unfavourable movement in the stock prices.
 UK
UK  AU
AU CA
CA US
US NZ
NZ Please wait processing your request...