Kalkine’s Global Tariff Report provides fully independent analysis and data-driven analysis of major global sectors affected by tariff changes, evaluating the implications these shifts may have on equity valuations across those industries. The report concentrates on trade-sensitive sectors that typically experience heightened investor scrutiny during periods of tariff uncertainty. It also identifies defensive and countercyclical segments that demonstrate relative resilience or may even outperform, amid disruptions to global trade flows.
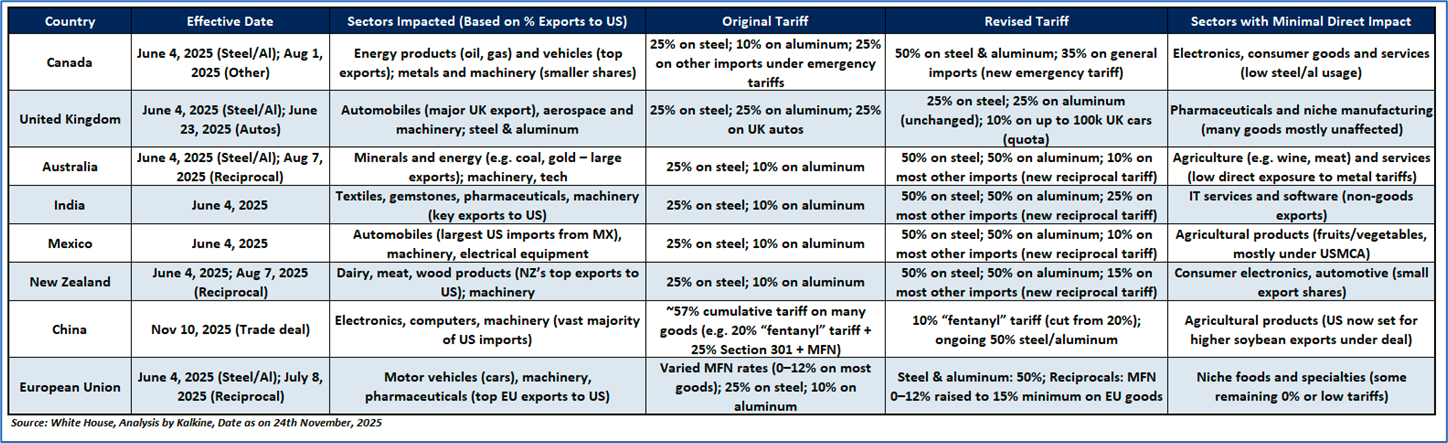
As illustrated in the table below, several key sectors in different countries are directly impacted by the recent tariff announcement from President Trump.
Latest Updates on Global Tariffs by Trump’s Administration
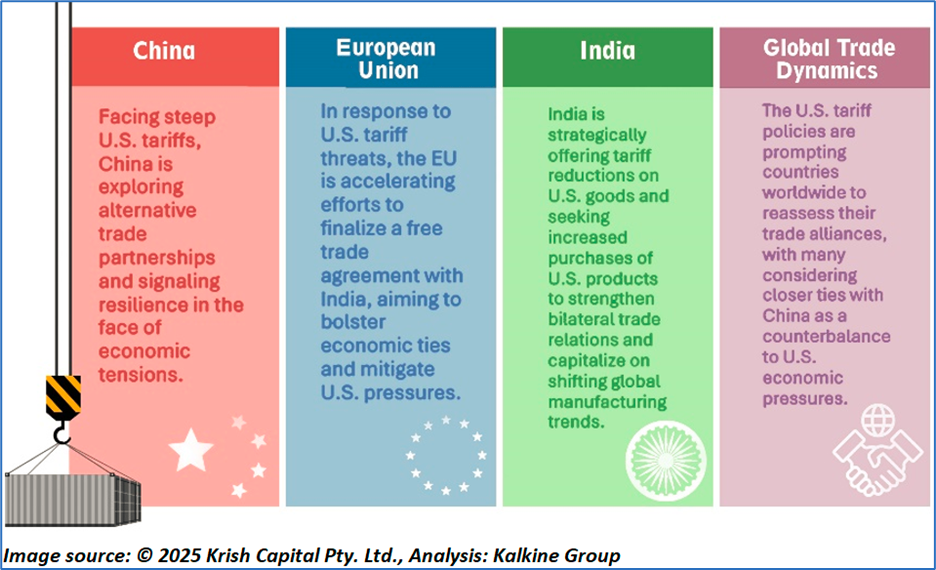
- China: The U.S. has escalated trade measures against China by imposing a sweeping 100% additional tariff on all Chinese imports, pushing total effective duties to around 130%, one of the harshest trade actions in modern U.S.–China relations. The sectors most exposed remain electronics, semiconductors, computers, EVs, batteries, industrial machinery, and critical components, amplifying global supply-chain risk. The action has already triggered sharp volatility across global markets, disrupted procurement pipelines for multinational OEMs, and raised inflationary pressure across the tech and automotive industries. Although agriculture remains relatively insulated due to recent U.S.–China food-supply agreements, spillover risks for global manufacturing hubs—especially South Korea, Taiwan, Japan, Mexico, and ASEAN economies—have intensified materially.
- Canada: Canada faces a significantly tightened U.S. tariff regime, now including 50% duties on steel and aluminum, and newly introduced 10–25% tariffs on lumber and wood furniture, set to escalate to 30–50% by early 2026. Additional reviews targeting semiconductors, truck components, pharmaceuticals, and film products signal further risk ahead. Canada removed most of its earlier counter-tariffs on USD 44.2 billion of U.S. goods but retained duties on metals and autos, reflecting a partial de-escalation. Key exposed sectors include energy exports, vehicles, metals, and heavy machinery, while consumer goods, electronics, and services remain minimally affected. The intensifying tariff environment poses new cost pressures for North American supply chains, particularly in construction, automotive manufacturing, and cross-border logistics.
- India: S. tariff policy toward India remains largely unchanged, maintaining 50% tariffs on core Indian exports such as textiles, gems & jewellery, auto components, and leather goods, alongside 50% steel/aluminum tariffs and 25% duties on most other manufactured products. These measures have triggered major stress for export-reliant MSMEs, with turnover declines of 30–50% in key sectors and rising input-cost inflation due to rupee weakness. Despite this, India has opted for a restrained, strategic response—keeping its counter-tariff levels unchanged while pursuing negotiations with a late-2025 deadline. Select sectors such as pharmaceuticals, IT services, and FMCG remain resilient due to exemptions, strong U.S. demand, and minimal direct tariff exposure. The ongoing tariff pressure poses risks to India’s USD 434 billion export economy, squeezing engineering exports and potentially softening GDP growth toward ~6%.
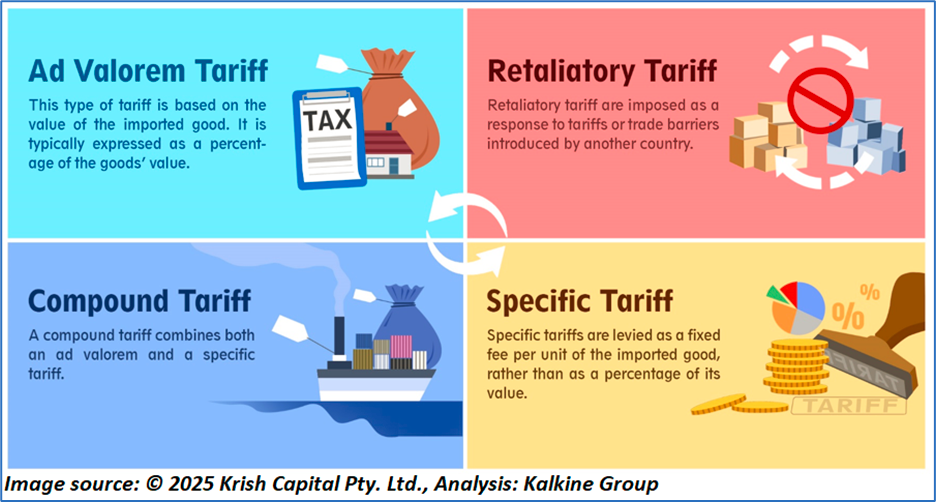
What are the different types of Tariffs?
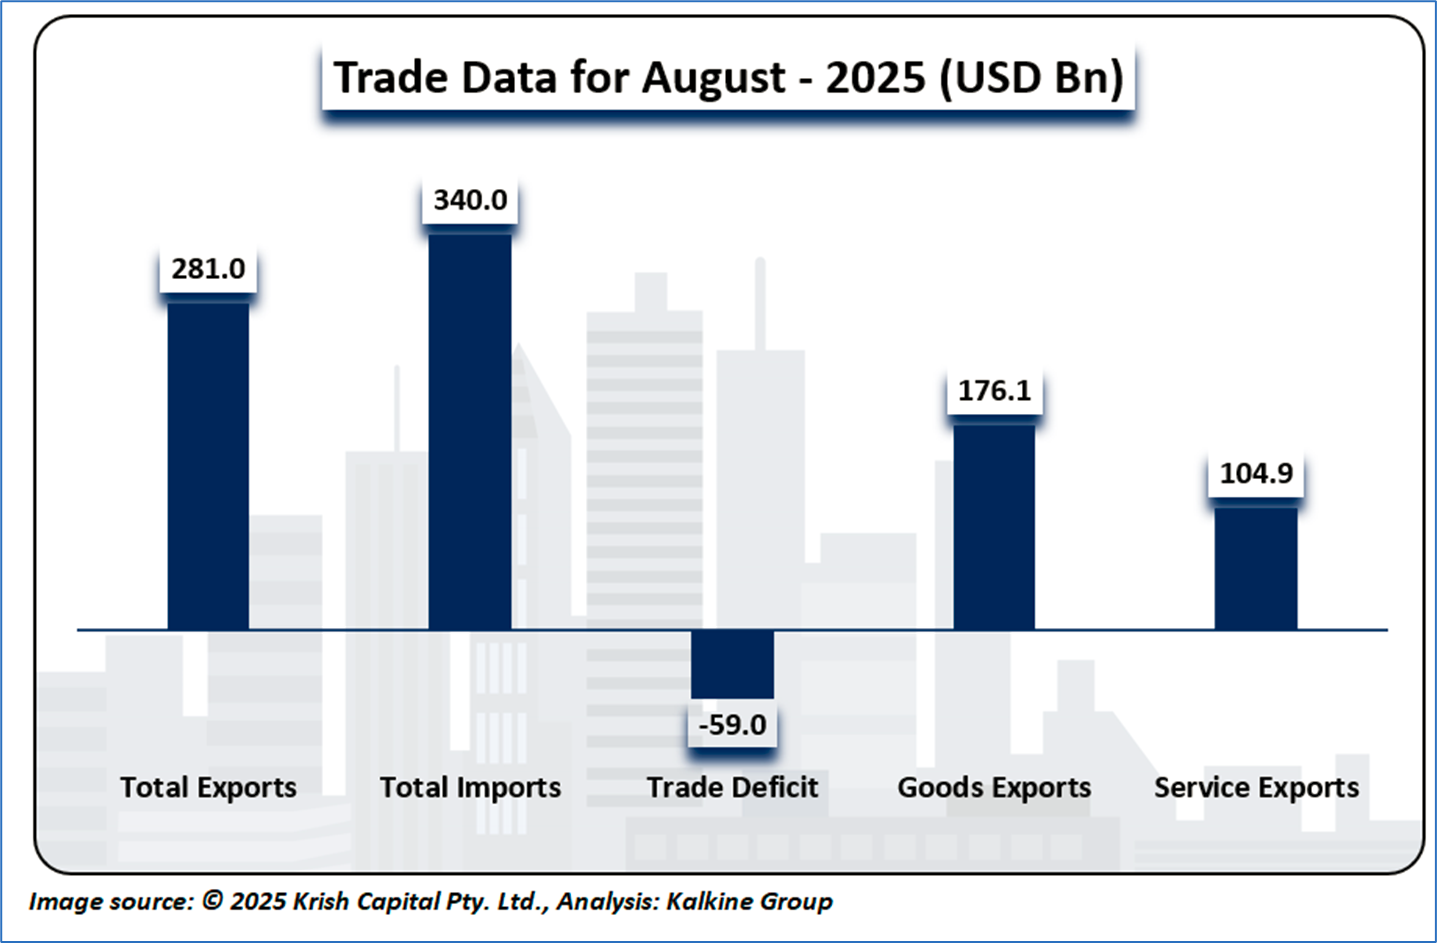
A Snapshot of USA’s Trade Size
In August 2025, the United States recorded total exports of USD 281 billion against imports of USD 340 billion, resulting in a trade deficit of USD 59 billion, reflecting continued import-heavy consumption and supply-chain dependence. Goods exports contributed USD 176.1 billion, supported primarily by industrial supplies, capital goods, and agricultural shipments, while services exports totaled USD 104.9 billion, driven by travel, financial services, and intellectual-property–related receipts. Overall, the data indicates a structurally wide U.S. trade gap, driven by strong domestic demand for foreign goods alongside resilient but insufficient services-sector surpluses.
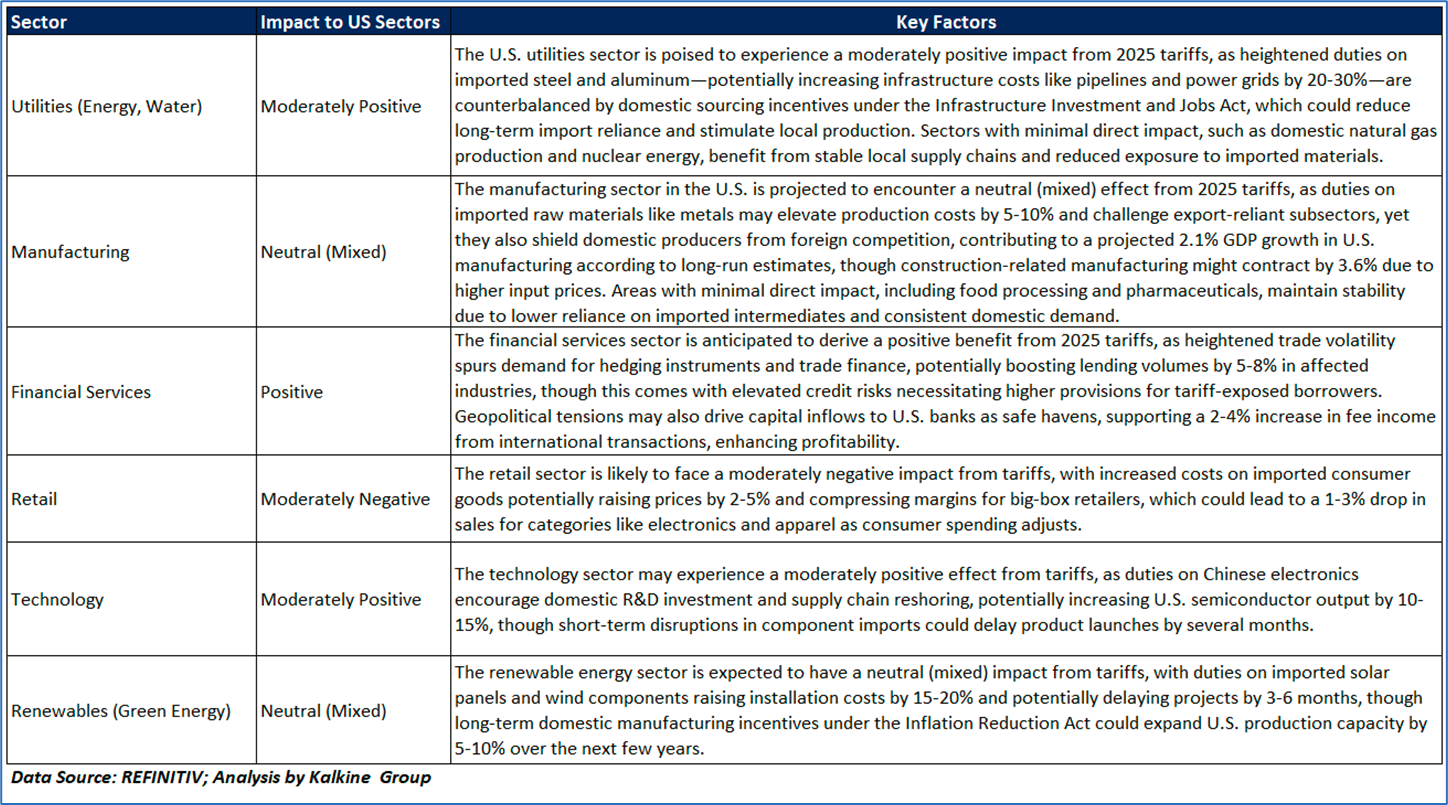
Impact of US Tariffs on Various Sectors
The U.S. economy is currently grappling with significant challenges, including high inflation, supply chain disruptions, and the effects of aggressive monetary policy from the Federal Reserve. Key sectors such as manufacturing, agriculture, and technology are feeling strain, particularly due to their dependence on global supply chains and export markets, with trade policies like tariffs on steel, aluminum, and electronics driving up costs for businesses and consumers alike. Despite these pressures, there’s cautious optimism in some quarters about market stabilization within the next year, though this is tempered by ongoing issues like labor shortages, energy price volatility, and political divisions. The Federal Reserve’s interest rate hikes aimed at curbing inflation—still above target levels—have slowed economic growth, raising recession risks, while strategic efforts such as trade agreements and supply chain diversification remain critical to fostering stability and mitigating prolonged uncertainty across these vital sectors.
Why does the US Beverages Industry look Attractive Amid Tariff Concerns?
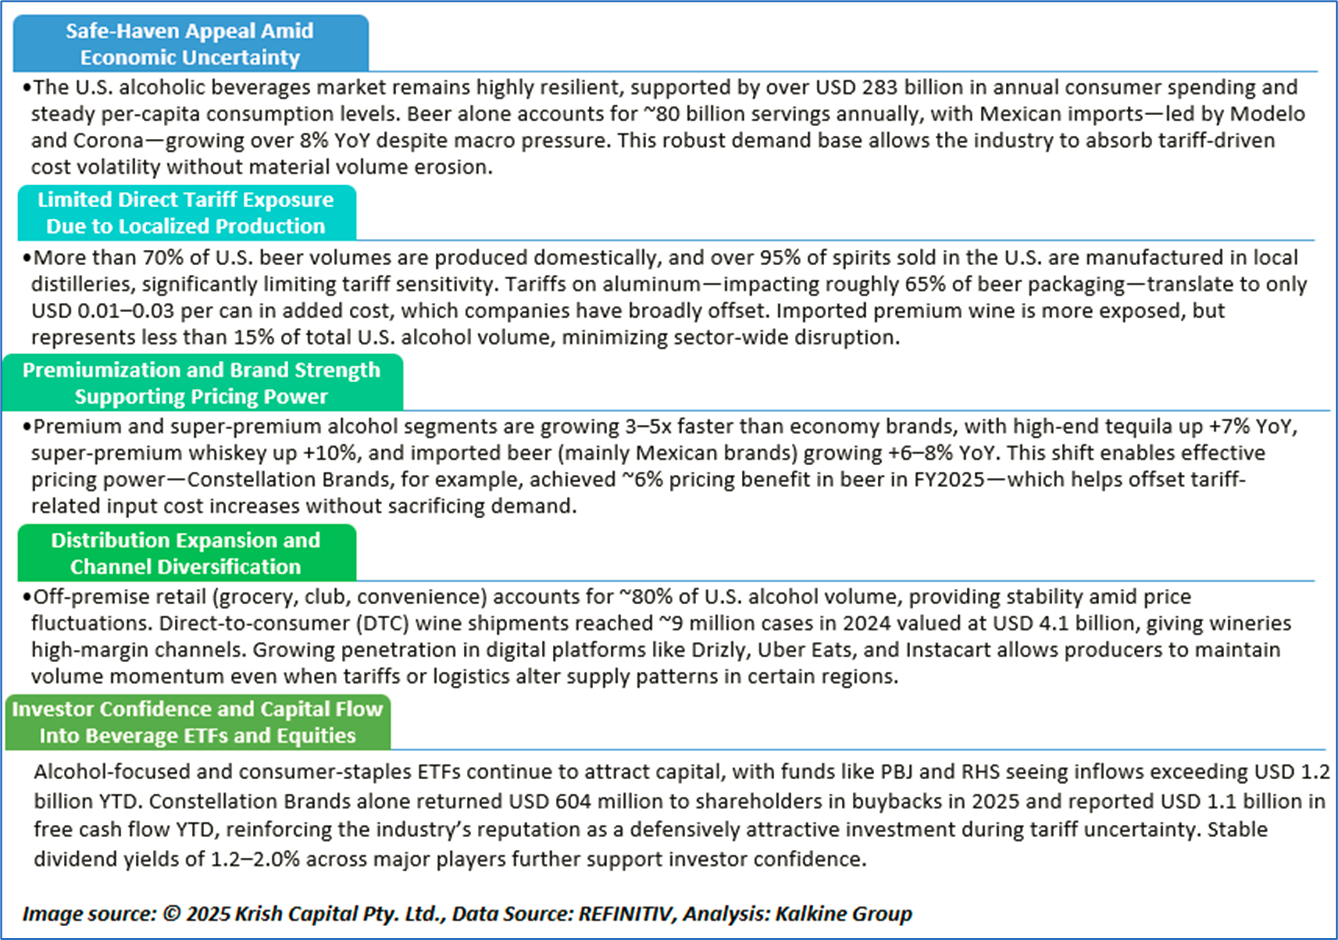
Amid elevated Market Volatility and Tariff pressures, Constellation Brands Inc (NYSE: STZ) stands out as our defensive pick within the Beverages Industry, supported by rigorous fundamental and technical research
Kalkine’s Global Tariff Report covers the Investment Highlights, Key Financial Metrics, Risks, Technical Analysis along with the Valuation, Target Price, and Recommendation on Constellation Brands Inc (NYSE: STZ).
Section 1: Company Overview and Fundamental Insights
1.1 Company Overview:
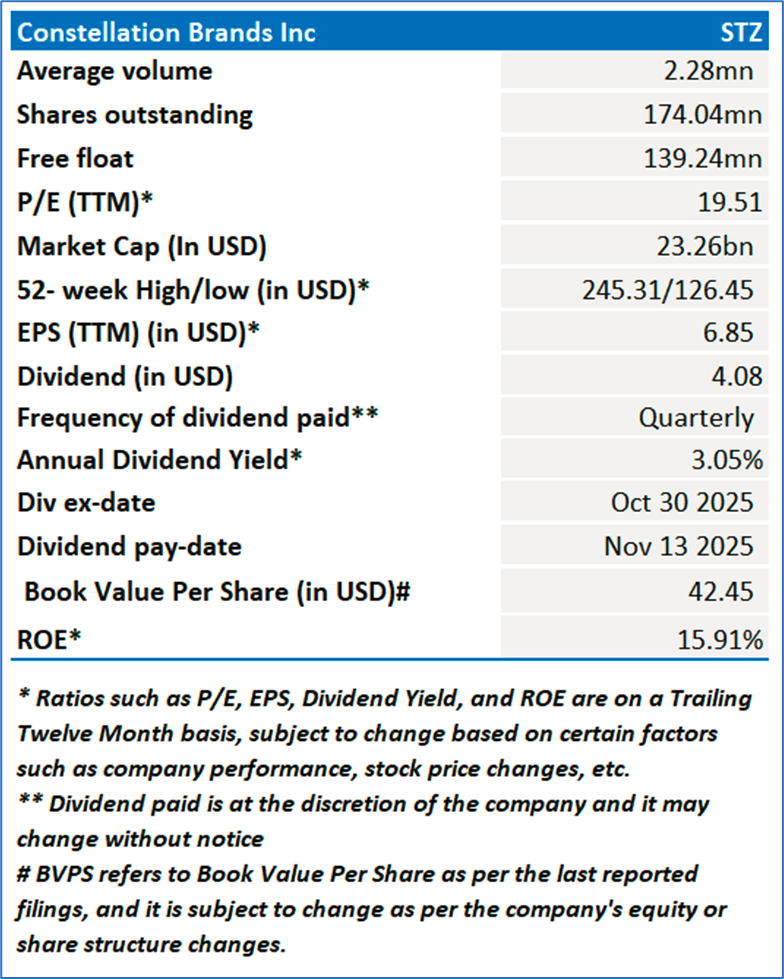
Constellation Brands, Inc. (NYSE: STZ) is a producer and marketer of beer, wine, and spirits with operations in the United States, Mexico, New Zealand, and Italy with brands, such as Corona Extra, Modelo Especial, Robert Mondavi Winery, Kim Crawford, The Prisoner Wine Company, High West, Casa Noble, and Mi CAMPO. Its segments include Beer, Wine and Spirits, and Corporate Operations and Other.
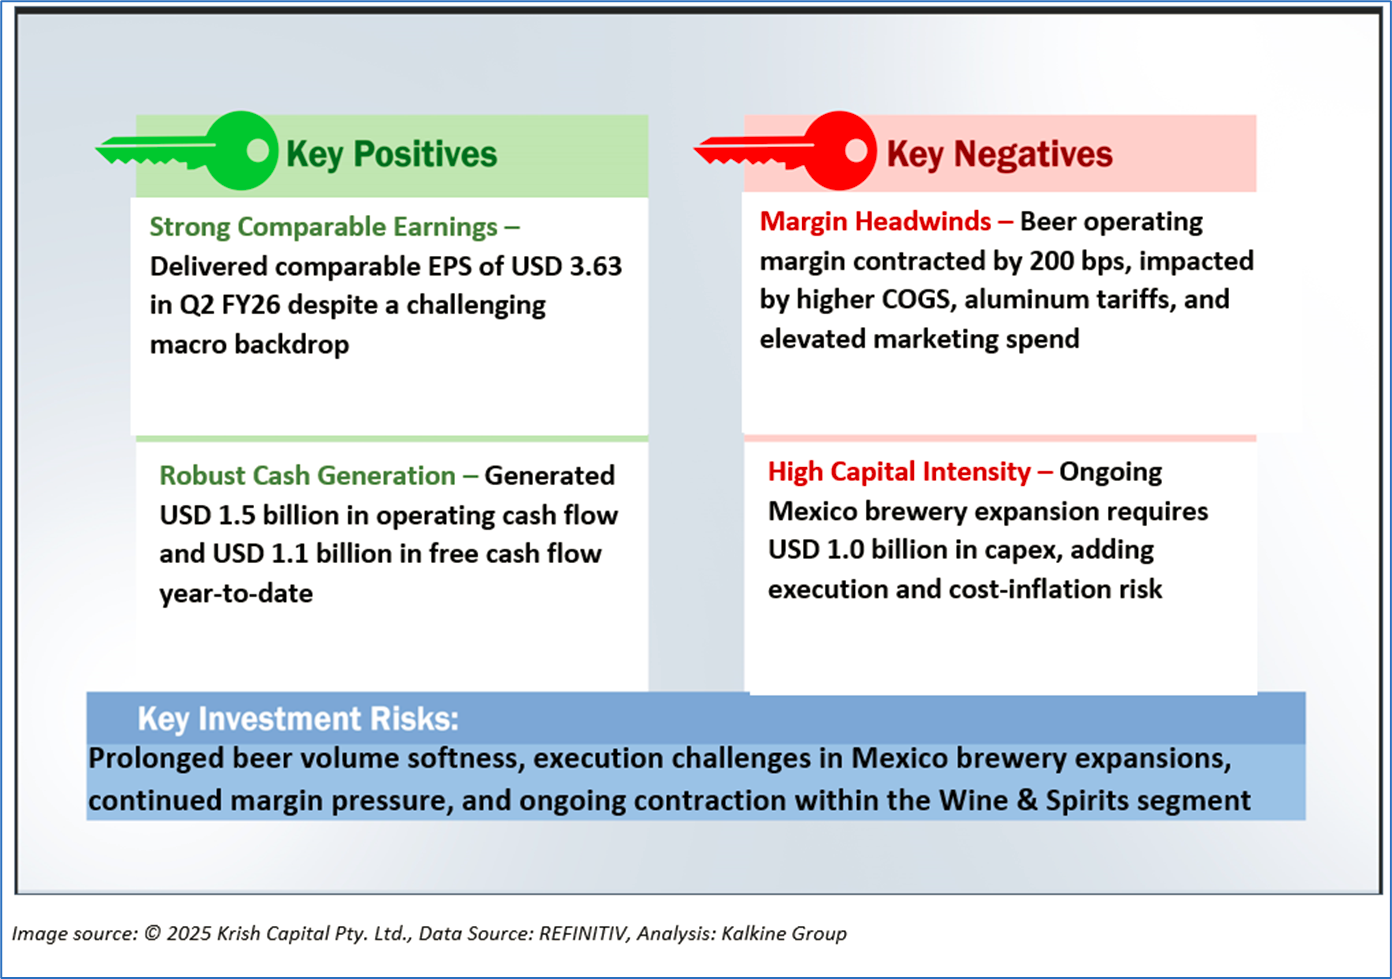
1.2 The Key Positives, Negatives, Investment Highlights and Risks
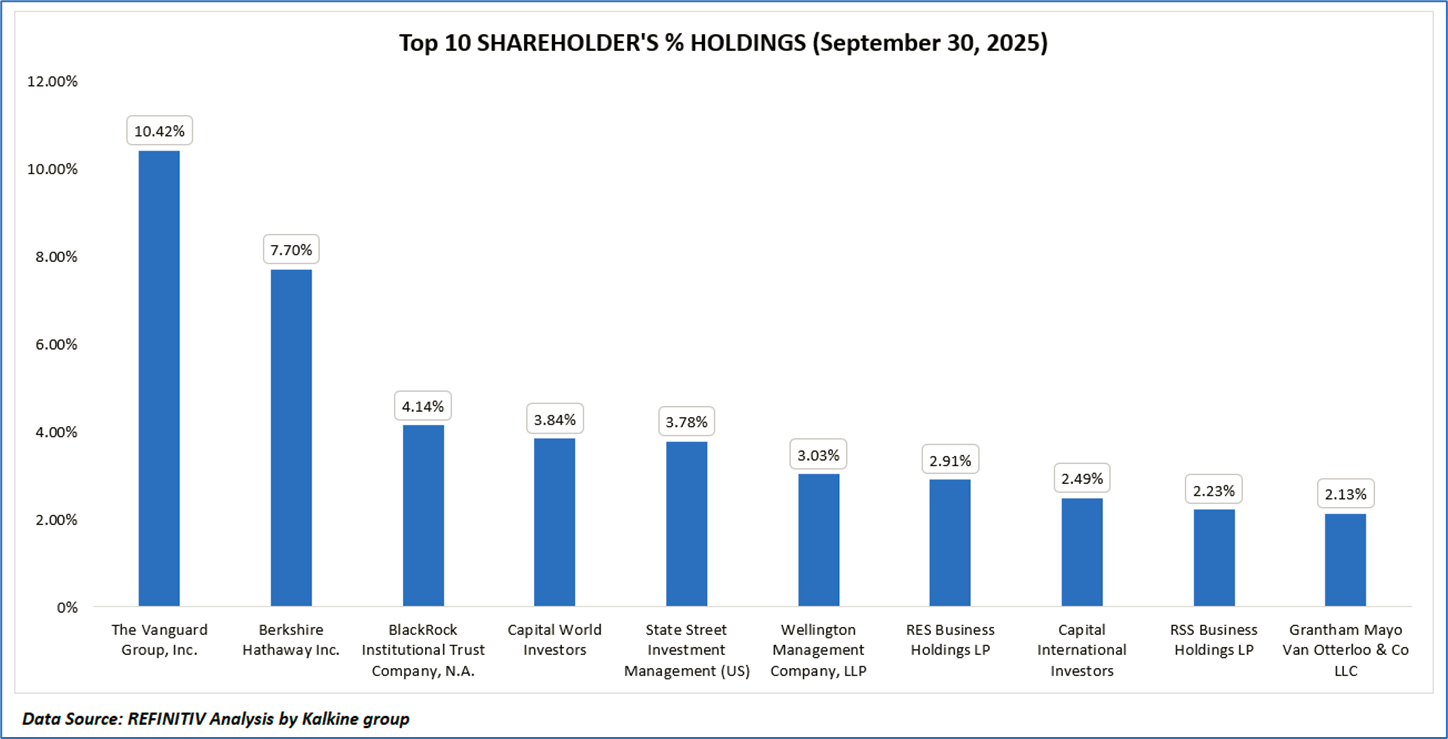
1.3 Top 10 Shareholders:
The top 10 shareholders together form ~42.68% of the total shareholding, indicating concentrated holding. The Vanguard Group, Inc., and Berkshire Hathaway Inc. hold a maximum stake in the company at ~10.42% and ~7.70%, respectively.
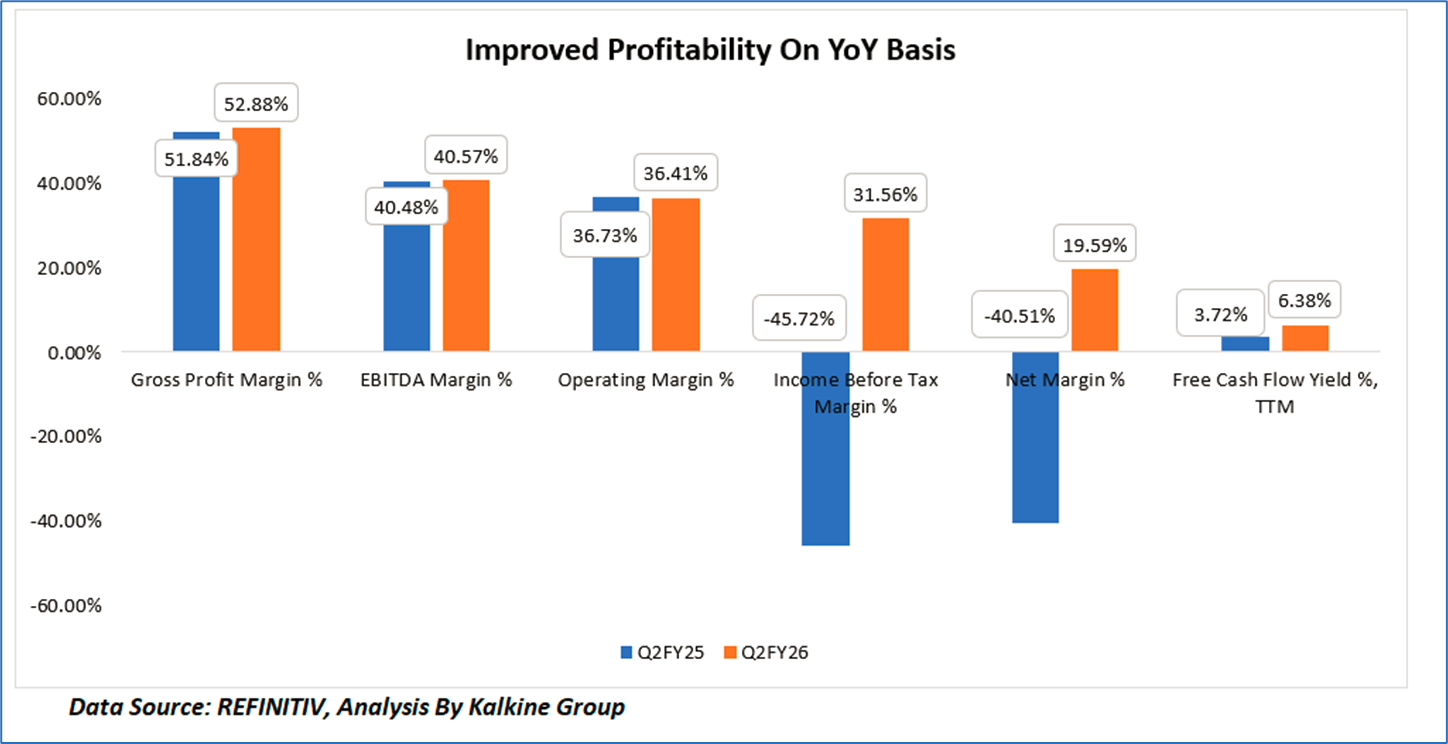
1.4 Key Metrics:
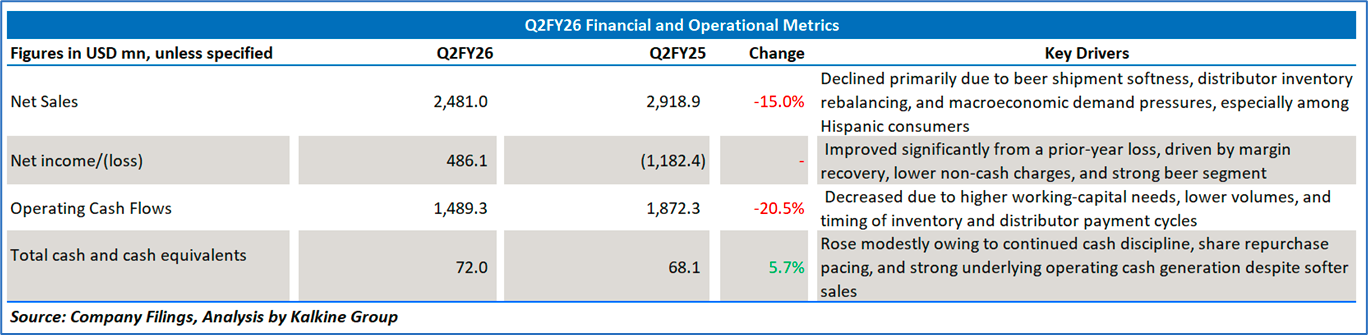
Constellation Brands (STZ) demonstrated a substantial improvement in profitability and capital efficiency in Q2 FY26 compared to Q2 FY25, with gross profit margin rising from 51.84% to 52.88% and EBITDA margin holding steady at ~40.5%, underscoring strong cost management despite softer top-line trends. While operating margin remained broadly stable at 36.4%, the most notable shift was the sharp recovery in income before tax margin from –45.72% to 31.56% and net margin from –40.51% to 19.59%, reflecting the absence of prior-year one-off charges and improved segment performance. Cash generation also strengthened meaningfully, with free cash flow yield rising from 3.72% to 6.38%, supported by disciplined capital allocation. Returns improved across the board, as return on average common equity more than doubled from 6.71% to 15.91%, and return on average total assets rose from 2.65% to 5.70%, signalling enhanced efficiency, better margin execution, and stronger shareholder value creation in FY26.
Section 2: Business Updates and Financial Highlights
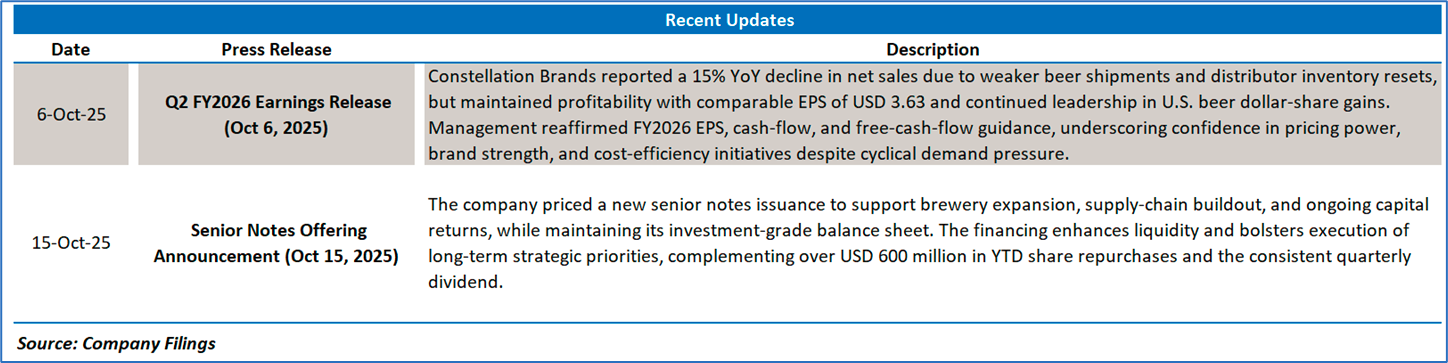
2.1 Recent Updates: The below picture gives an overview of the company’s update on its next reporting date.
2.2 Insights into Q2FY26 Financial Performance:
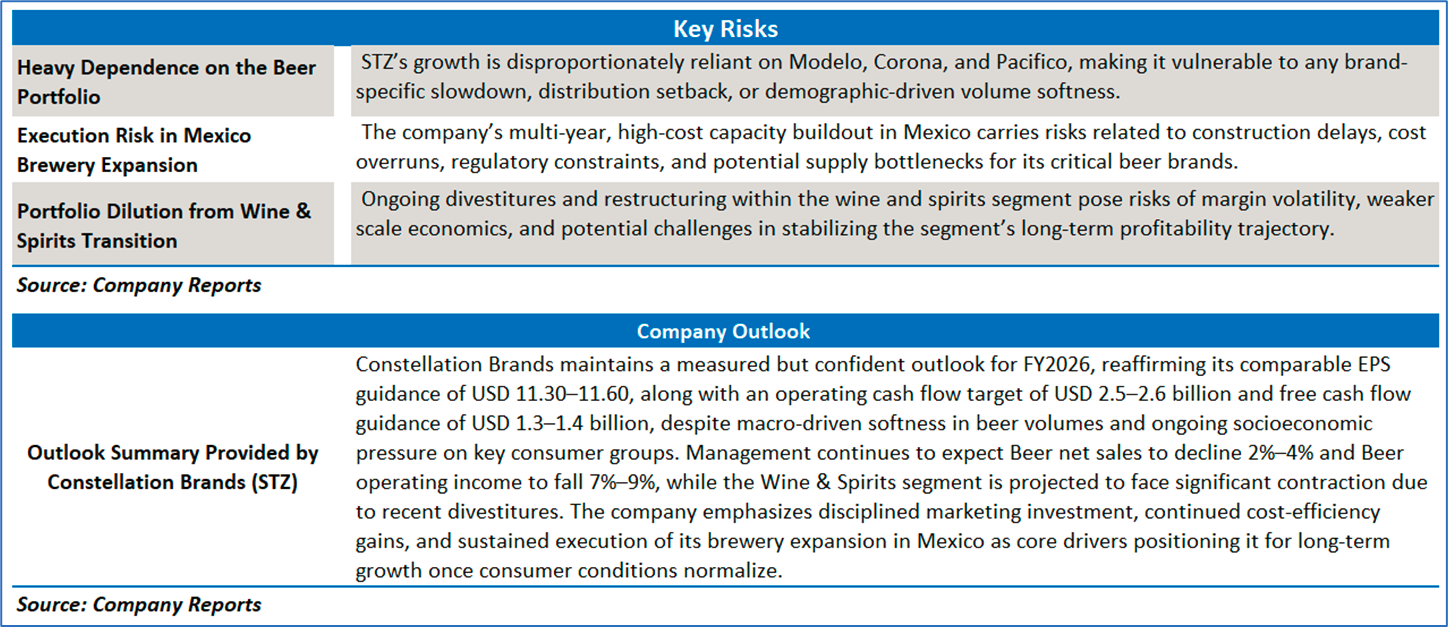
Section 3: Key Risks, Company Outlook:
Section 4: Stock Recommendation Summary:
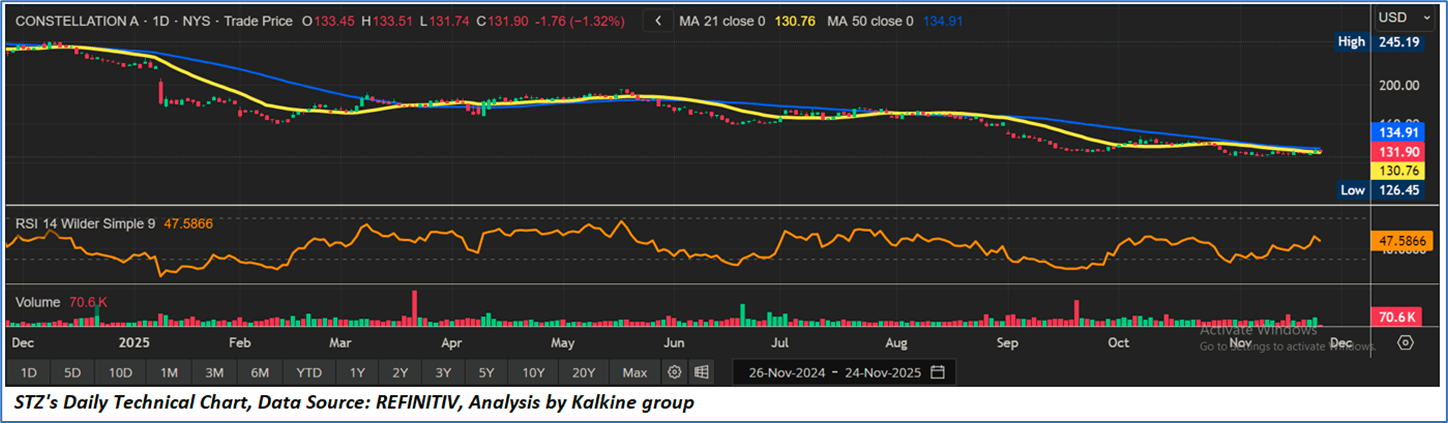
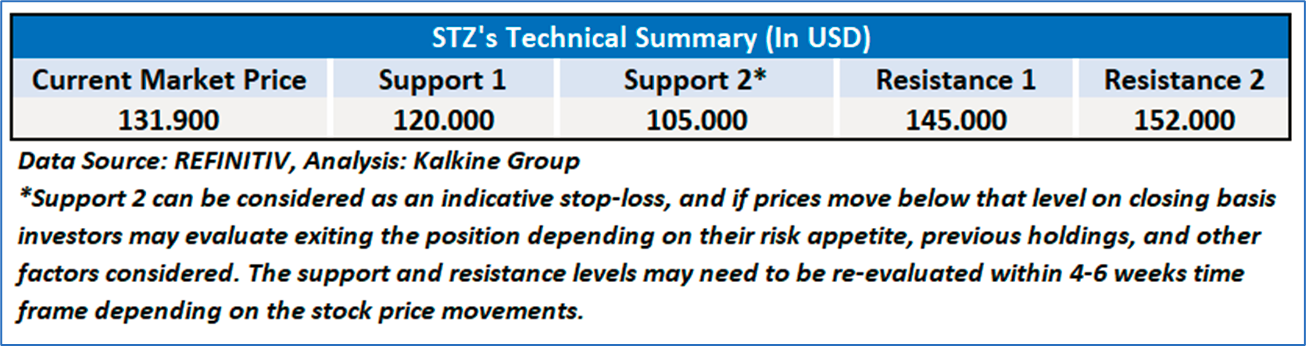
4.1 Price Performance and Technical Summary:
- Price Structure and Moving Averages: STZ’s price has stabilized above the 21-day moving average, indicating fading downside momentum, while the narrowing gap between the 21-day and 50-day averages suggests weakening bearish pressure and an improvement in the setup for a potential recovery toward the 50-day average.
- Momentum and RSI Trend: The RSI near 47.6 reflects a steady rebound from prior oversold conditions, signaling improving sentiment; a move above the mid-50 range would confirm a shift toward bullish momentum if supported by consistent buying interest.
- Volume Profile and Outlook: Low but steady volumes and a firm hold above the USD 126.45 support level indicate a constructive base forming, and with tightening moving averages and strengthening momentum, the near-term bias turns modestly bullish with upside potential toward the USD 135–140 zone.
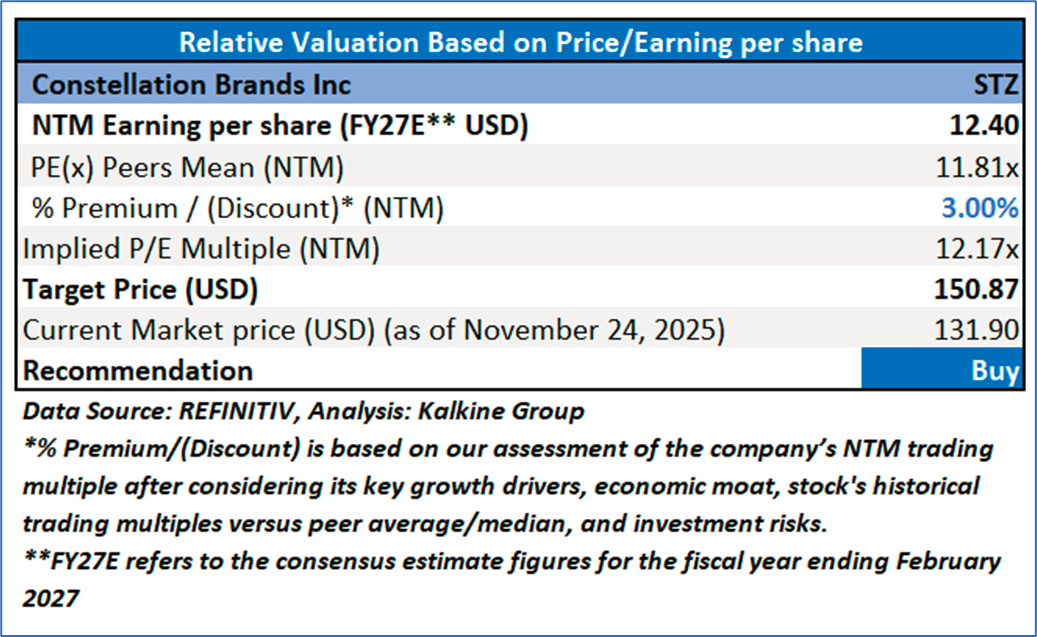
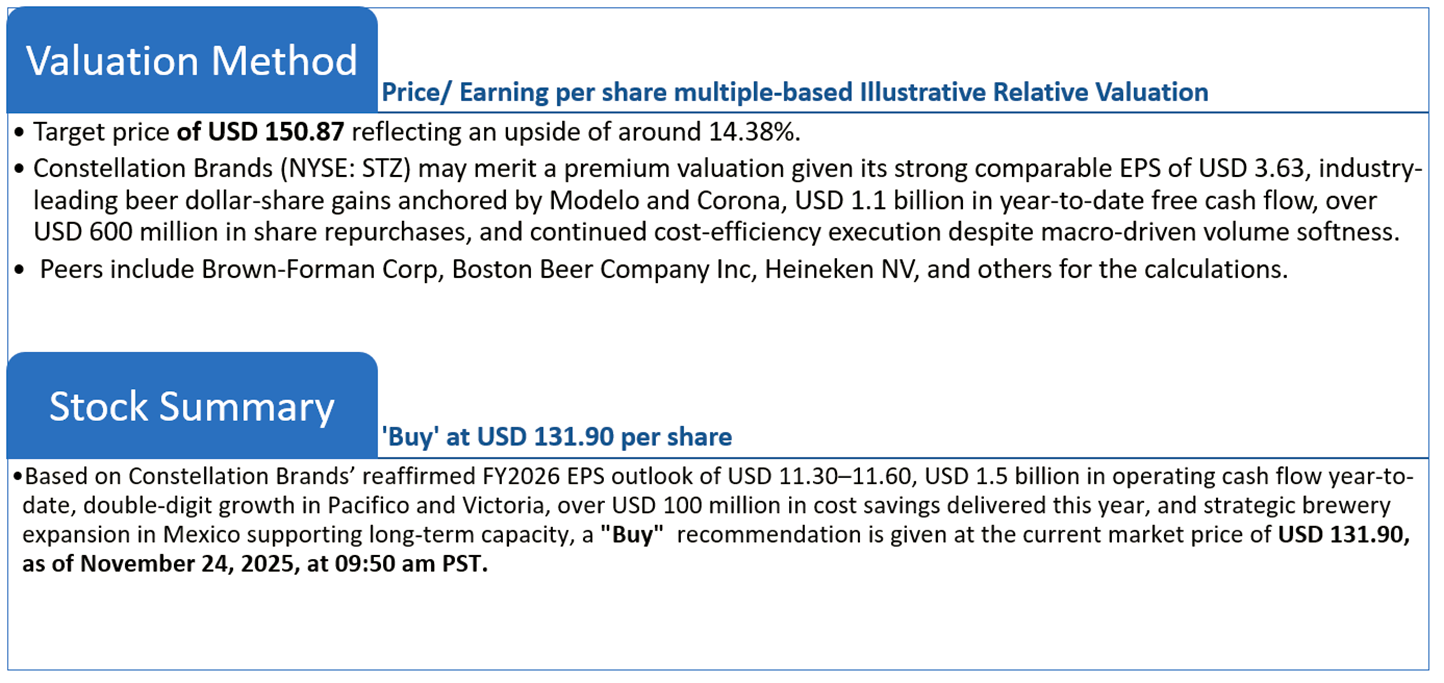
4.2 Fundamental Valuation
Valuation Methodology: Price/ Earnings Per Share Multiple Based Relative Valuation (Illustrative)
Note 1: Past performance is not a reliable indicator of future performance.
Note 2: The reference date for all price data, currency, technical indicators, support, and resistance levels as on November 24, 2025. The reference data in this report has been partly sourced from REFINITIV.
Note 3: Investment decisions should be made depending on an individual's appetite for upside potential, risks, holding duration, and any previous holdings. An 'Exit' from the stock can be considered if the Target Price mentioned as per the Valuation and or the technical levels provided has been achieved and is subject to the factors discussed above.
Note 4: Dividend Yield may vary as per the stock price movement.
Note 5: Kalkine reports are prepared based on the stock prices captured either from REFINITIV or Trading View. Typically, REFINITIV or Trading View may reflect stock prices with a delay which could be a lag of 25-30 minutes. There can be no assurance that future results or events will be consistent with the information provided in the report. The information is subject to change without any prior notice.
Technical Indicators Defined: -
Support: A level at which the stock prices tend to find support if they are falling, and a downtrend may take a pause backed by demand or buying interest.
Resistance: A level at which the stock prices tend to find resistance when they are rising, and the uptrend may take a pause due to profit booking or selling interest.
Stop-loss: In general, it is a level to protect further losses in case of any unfavorable movement in the stock prices.
Disclaimer-
This report has been issued by Kalkine Limited (Company number 07903332), a private limited company, incorporated in England and Wales ("Kalkine”). Kalkine.co.uk and associated pages are published by Kalkine. Kalkine is authorised and regulated by the Financial Conduct Authority under reference number 579414.
The information in this report and on the Kalkine website has been prepared from a wide variety of sources, which Kalkine, to the best of its knowledge and belief, considers accurate. Kalkine has made every effort to ensure the reliability of information contained in its reports, newsletters and websites. All information represents our views at the date of publication and may change without notice. The information in this report does not constitute an offer to sell securities or other financial products or a solicitation of an offer to buy securities or other financial products. Our reports contain non personalized recommendations to invest in securities and other financial products.
Kalkine does not offer financial advice based upon your personal financial situation or goals, and we shall not be held liable for any investment or trading losses you may incur by using the opinions expressed in our reports, publications, market updates, news alerts and corporate profiles. Kalkine does not intend to exclude any liability which it is not permitted to exclude under applicable law or regulation. Kalkine’s non-personalised advice does not in any way endorse or recommend individuals, investment products or services for your personal financial situation. You should discuss your portfolios and the risk tolerance level appropriate for your personal financial situation, with a professional authorised financial planner and adviser. You should be aware that the value of any investment and the income from it can go down as well as up and you may not get back the amount invested.
Please also read our Terms & Conditions for further information. Employees and/or associates of Kalkine and its related entities may hold interests in the securities or other financial products covered in this report or on the Kalkine website. Any such employees and associates are required to comply with certain safeguards, procedures and disclosures as required by law.
Kalkine Media Limited, an affiliate of Kalkine, may have received, or be entitled to receive, financial consideration in connection with providing information about certain entity(s) covered on its website including entities covered in this report.
Past performance is not a reliable indicator of future performance.

 Please wait processing your request...