Section 1: Company Overview and Fundamentals
1.1 Company Overview:
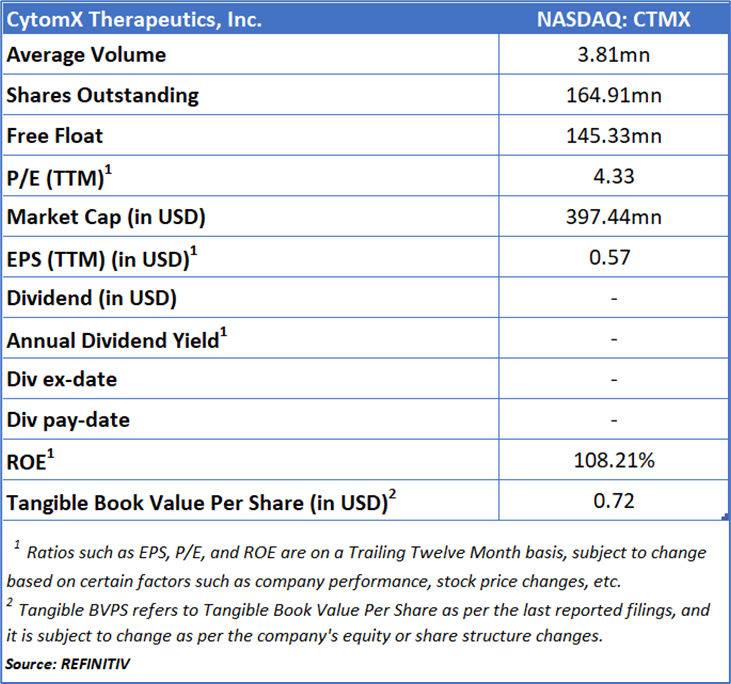
CytomX Therapeutics, Inc. (NASDAQ: CTMX) is a clinical-stage biopharmaceutical company specializing in oncology. It is dedicated to developing conditionally activated masked biologics engineered to specifically target and act within the tumor microenvironment.
Kalkine’s Diversified Opportunities Report covers the Company Overview, Key positives & negatives, Investment summary, Key investment metrics, Top 10 shareholding, Business updates and insights into company recent financial results, Key Risks & Outlook, Price performance and technical summary, Target Price, and Recommendation on the stock.
Stock Performance:
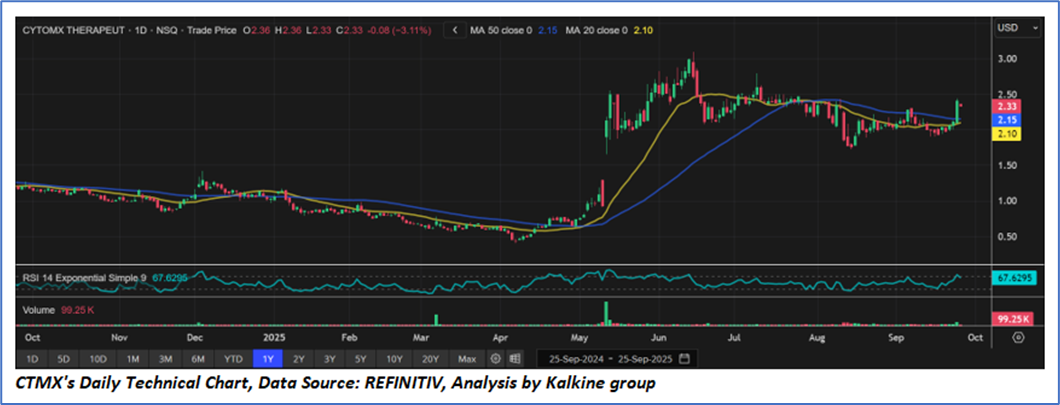
- The stock has been in a long-term consolidation phase until late March 2025, after which it experienced a sharp breakout rally in April–May, taking the price from below USD 1.00 to above USD 3.00. Following the peak in May–June, the price entered a corrective phase, retracing gains but finding support around the USD 1.70–USD 1.80 range.
- Recently, the stock has shown renewed strength, breaking above both the 20-day (USD 2.10) and 50-day (USD 2.15) moving averages on significant momentum, indicating a potential short-term bullish reversal.
- The RSI (14) at 67.63 indicates strong bullish momentum but also raising caution for a possible near-term pullback or consolidation if the stock enters overbought territory.
- The session closed with 13.35M shares traded, showing a clear volume spike compared to prior sessions. This volume confirmation supports the bullish breakout.
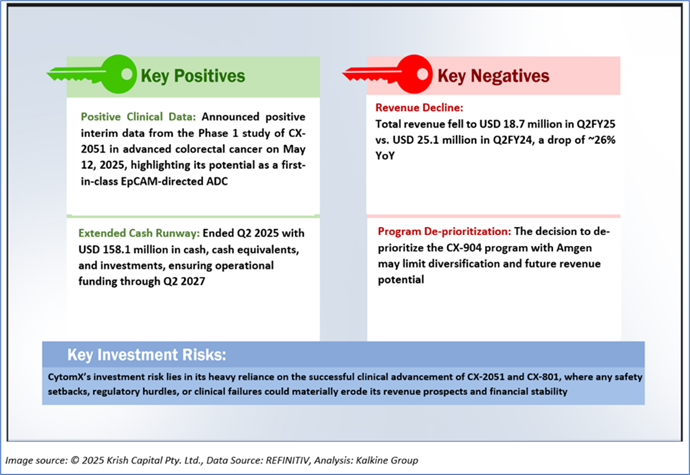
1.2 The Key Positives, Negatives, and Investment summary
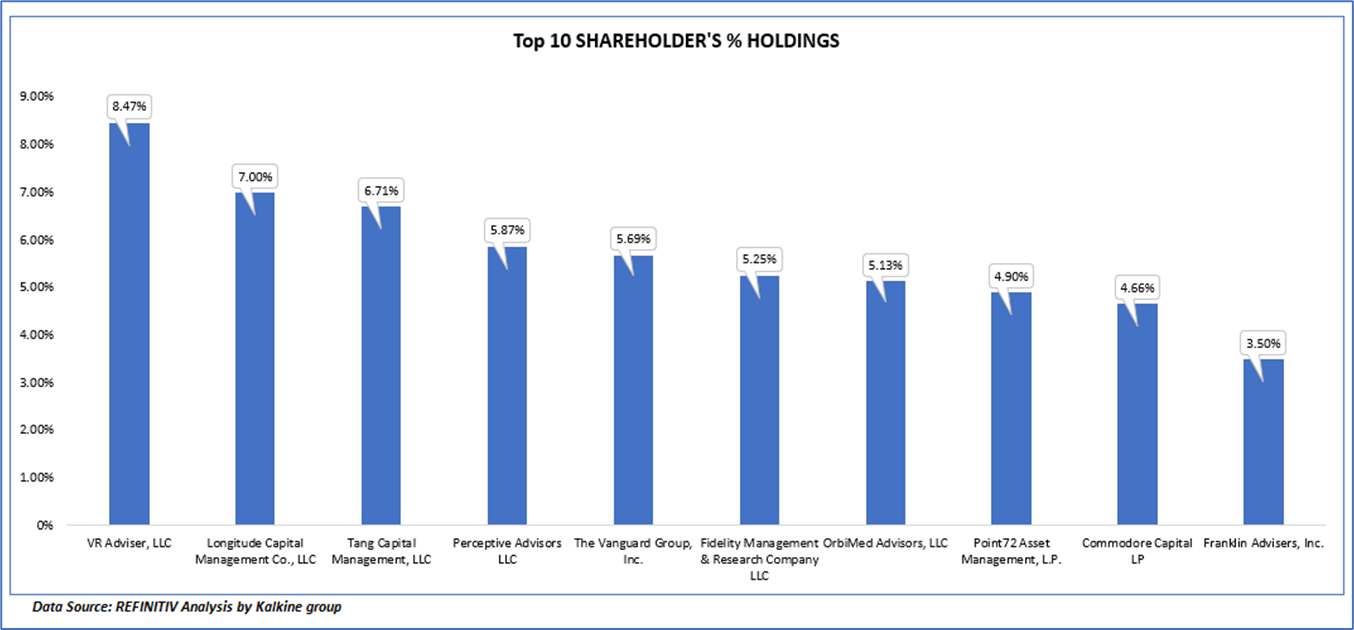
1.3 Top 10 shareholders:
The top 10 shareholders together form ~ 57.18% of the total shareholding, signifying concentrated shareholding. VR Adviser, LLC. and Longitude Capital Management Co., LLC are the biggest shareholders, holding the maximum stake in the company at 8.47% and 7.00%, respectively.
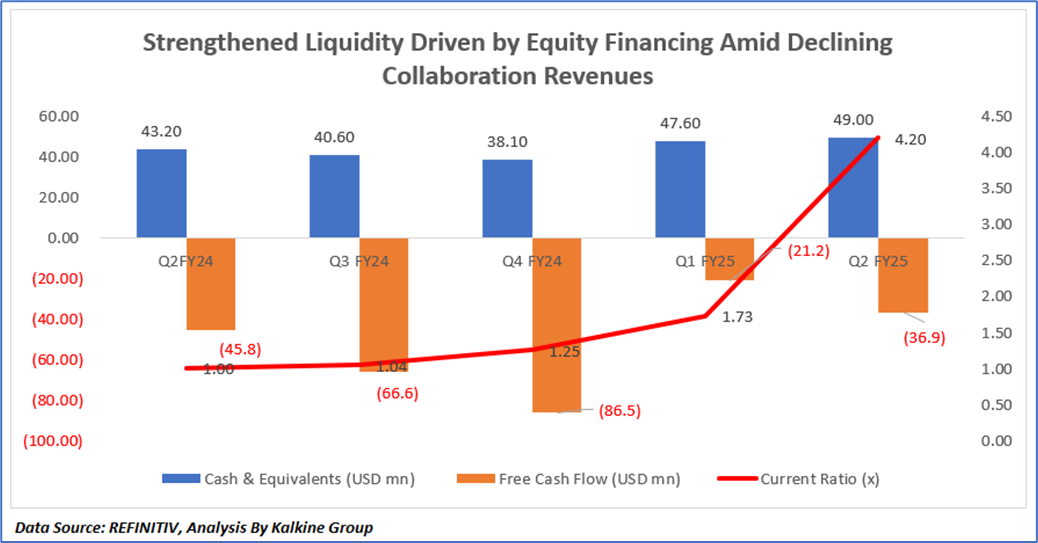
1.4 Key Metrics:
The financial trends in the chart reflect a company that has significantly strengthened its liquidity position despite ongoing operating losses. Cash and equivalents increased from USD 38.1 million in Q4FY24 to USD 49.0 million in Q2FY25, largely due to the USD 100 million equity financing completed in the quarter, which more than offset operating outflows. Free cash flow losses narrowed from USD (86.5) million in Q4FY24 to USD (36.9) million in Q2FY25, driven by disciplined cost control, including a USD 11.9 million year-over-year reduction in R&D expenses following the absence of a one-time milestone payment and program deprioritizations, as well as USD 1.8 million lower G&A costs. At the same time, the current ratio improved sharply from 1.25 in Q4FY24 to 4.20 in Q2FY25, reflecting both the cash inflow from financing and a steep decline in current liabilities as deferred revenue balances fell from USD 67.2 million at FY24-end to USD 22.0 million in Q2FY25. However, revenues weakened by ~26% year-over-year, dropping from USD 25.1 million in Q2FY24 to USD 18.7 million in Q2FY25, as contributions from BMS, Amgen, and Moderna collaborations decreased. Overall, while the company’s balance sheet and solvency metrics appear stronger due to external funding and lower expenses, the underlying business remains reliant on financing amid declining revenue visibility.
Section 2: Business Updates and Corporate Business Highlights
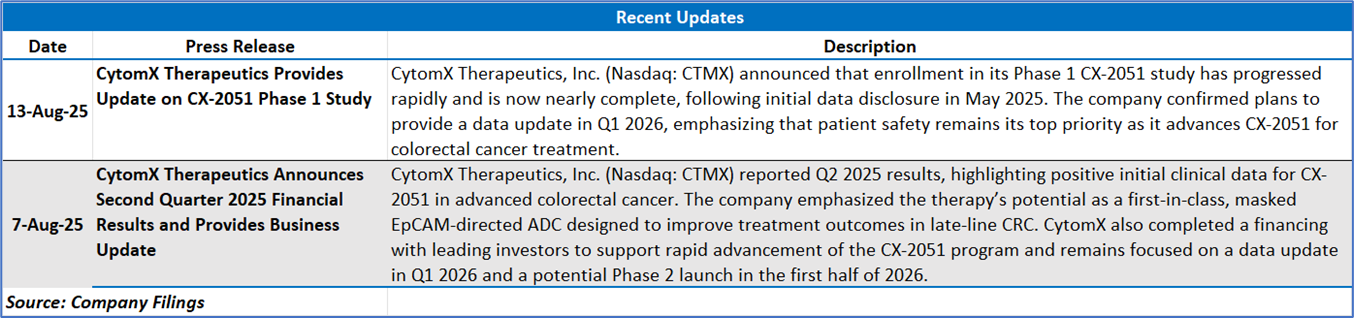
2.1 Recent Business Updates
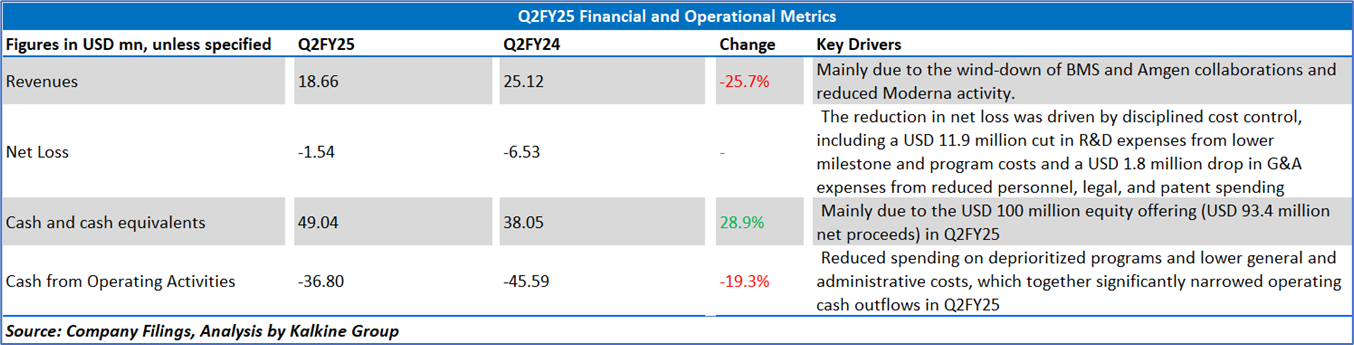
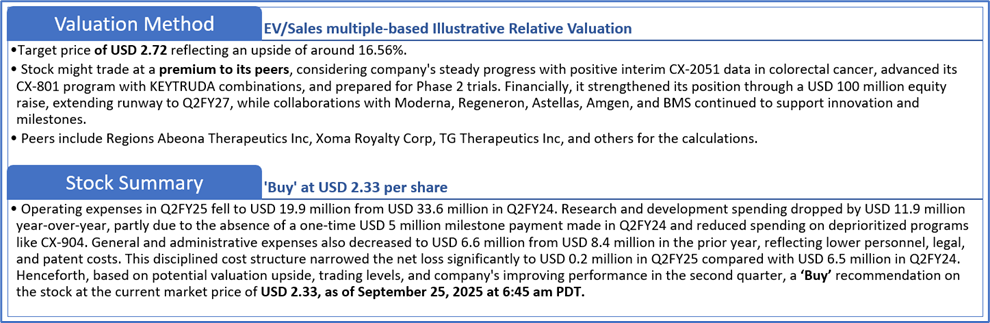
2.2 Insights of Q2FY25:
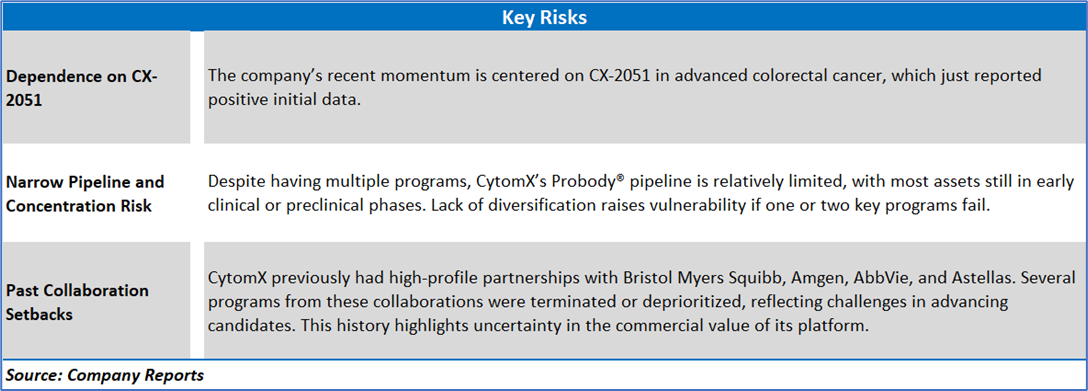
Section 3: Key Risks & Outlook
Section 4: Stock Recommendation Summary:
4.1 Price Performance and Technical Summary:
Stock Performance:
- The stock has been in a long-term consolidation phase until late March 2025, after which it experienced a sharp breakout rally in April–May, taking the price from below USD 1.00 to above USD 3.00. Following the peak in May–June, the price entered a corrective phase, retracing gains but finding support around the USD 1.70–USD 1.80 range.
- Recently, the stock has shown renewed strength, breaking above both the 20-day (USD 2.10) and 50-day (USD 2.15) moving averages on significant momentum, indicating a potential short-term bullish reversal.
- The RSI (14) at 67.63 indicates strong bullish momentum but also raising caution for a possible near-term pullback or consolidation if the stock enters overbought territory.
- The session closed with 13.35M shares traded, showing a clear volume spike compared to prior sessions. This volume confirmation supports the bullish breakout.
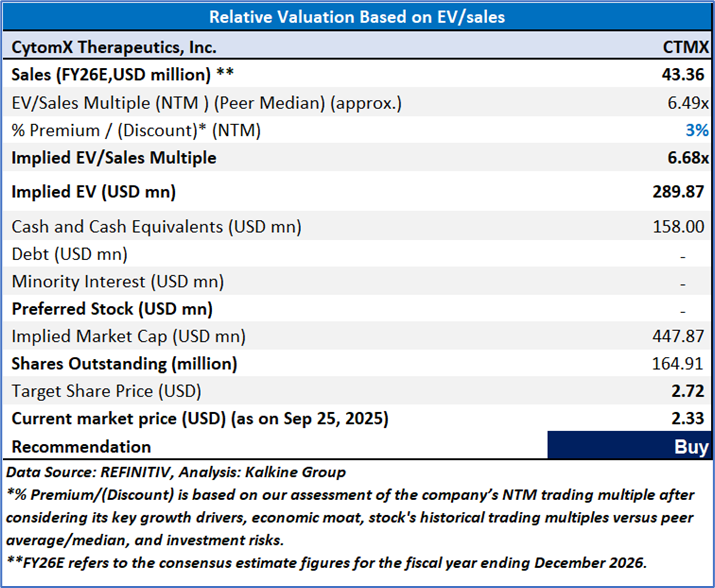
4.2 Fundamental Valuation
Valuation Methodology: EV/Sales Multiple Based Relative Valuation
Markets are trading in a highly volatile zone currently due to certain macroeconomic issues and geopolitical tensions prevailing. Therefore, it is prudent to follow a cautious approach while investing.
Note 1: Past performance is not a reliable indicator of future performance.
Note 2: The reference date for all price data, currency, technical indicators, support, and resistance levels is September 25, 2025. The reference data in this report has been partly sourced from REFINITIV.
Note 3: Investment decisions should be made depending on an individual's appetite for upside potential, risks, holding duration, and any previous holdings. An 'Exit' from the stock can be considered if the Target Price mentioned as per the Valuation and or the technical levels provided has been achieved and is subject to the factors discussed above.
Note 4: The report publishing date is as per the Pacific Time Zone.
Technical Indicators Defined: -
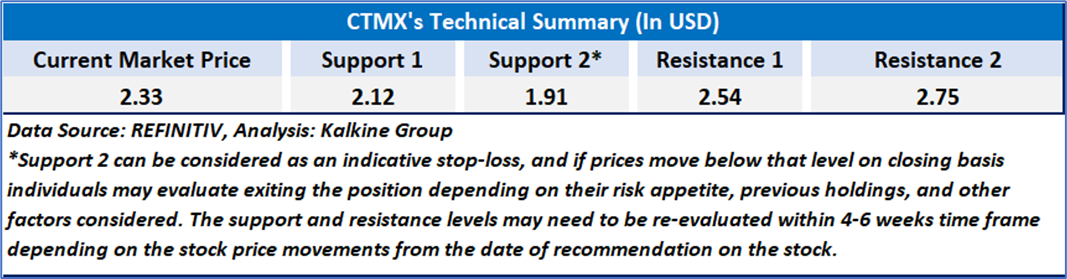
Support: A level at which the stock prices tend to find support if they are falling, and a downtrend may take a pause backed by demand or buying interest. Support 1 refers to the nearby support level for the stock and if the price breaches the level, then Support 2 may act as the crucial support level for the stock.
Resistance: A level at which the stock prices tend to find resistance when they are rising, and an uptrend may take a pause due to profit booking or selling interest. Resistance 1 refers to the nearby resistance level for the stock and if the price surpasses the level, then Resistance 2 may act as the crucial resistance level for the stock.
Stop-loss: It is a level to protect against further losses in case of unfavorable movement in the stock prices.
Disclaimer-
This report has been issued by Kalkine Limited (Company number 07903332), a private limited company, incorporated in England and Wales ("Kalkine”). Kalkine.co.uk and associated pages are published by Kalkine. Kalkine is authorised and regulated by the Financial Conduct Authority under reference number 579414.
The information in this report and on the Kalkine website has been prepared from a wide variety of sources, which Kalkine, to the best of its knowledge and belief, considers accurate. Kalkine has made every effort to ensure the reliability of information contained in its reports, newsletters and websites. All information represents our views at the date of publication and may change without notice. The information in this report does not constitute an offer to sell securities or other financial products or a solicitation of an offer to buy securities or other financial products. Our reports contain non personalized recommendations to invest in securities and other financial products.
Kalkine does not offer financial advice based upon your personal financial situation or goals, and we shall not be held liable for any investment or trading losses you may incur by using the opinions expressed in our reports, publications, market updates, news alerts and corporate profiles. Kalkine does not intend to exclude any liability which it is not permitted to exclude under applicable law or regulation. Kalkine’s non-personalised advice does not in any way endorse or recommend individuals, investment products or services for your personal financial situation. You should discuss your portfolios and the risk tolerance level appropriate for your personal financial situation, with a professional authorised financial planner and adviser. You should be aware that the value of any investment and the income from it can go down as well as up and you may not get back the amount invested.
Please also read our Terms & Conditions for further information. Employees and/or associates of Kalkine and its related entities may hold interests in the securities or other financial products covered in this report or on the Kalkine website. Any such employees and associates are required to comply with certain safeguards, procedures and disclosures as required by law.
Kalkine Media Limited, an affiliate of Kalkine, may have received, or be entitled to receive, financial consideration in connection with providing information about certain entity(s) covered on its website including entities covered in this report.
Past performance is not a reliable indicator of future performance.

 Please wait processing your request...